After 3 months of work towards AerospaceResearch, the time has come to write my last devblog related to this year’s edition of GSoC. This might be a long one, so please bear with me for the next few minutes. At the end of the post, there’s a section with all my work throughout the project.
Assigning data to UI elements
Since the last post, the AssignData Window has suffered considerable changes. I had to re-design it from scratch due to some limitations related to JavaFX’s TreeView implementation. Moving items from one tree to another causes them to behave incorrectly. I had to stick to another solution that may not look as smooth and intuitive but performs way better and actually works.
This is what it looks like:
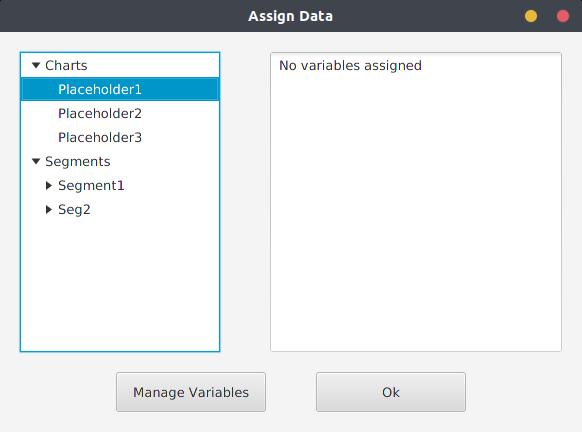
The tree to the left shows all states and charts that the user previously selected. When one is clicked, the right text area shows what variables are currently assigned to it. By clicking the ‚Manage Variables‘ a new window is displayed with all the current sensors and variables from the currently selected protocol:
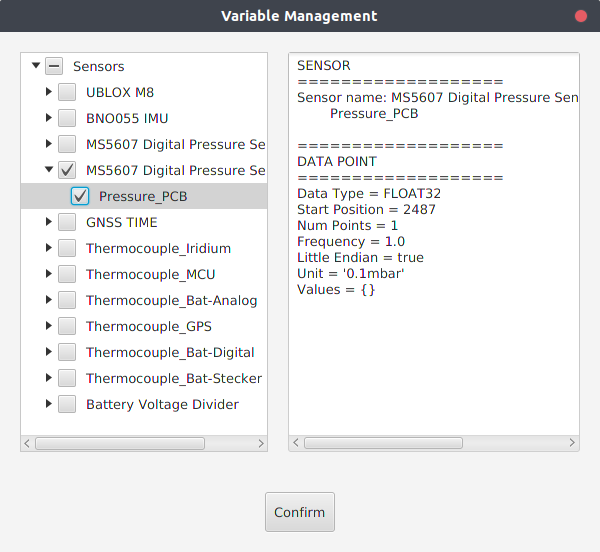
My first iteration of this last window brought some problems. Tree Views in JavaFX must represent an object and thus, since I wanted to show Charts/States (in the first window) and Sensors/Variables (in the latter window, shown above), I chose to display simple Strings. I quickly realized that this implementation was far from being the best one. The process of fetching all sensors from the protocol and getting their names, creating a tree with those names and then having to find the correct instance of each when selecting one. The cons are obvious: more overhead, possible loss of references, etc… An interface was created to solve this problem, called UIElement. It holds no behaviour (empty interface) and it’s only purpose is used to group different objects that can be displayed in the same TreeView.
Other major problems came when saving a layout to a file. I was outputting all sensor and variable information to the configuration file. All the information from a sensor and data point do not belong there. That’s why the protocol XML file is there for. This brought too much redundancy that was unneeded. Data Transfer Objects (DTO) were created (SensorDTO and VarDTO) to output information to the layout.
As of now, the core/foundation of the process of assigning data is finished. At a given moment, there is a configuration class that tells what variables and sensors should be displayed in a given chart/state. However, there is still some work to do so that the charts and states actually show the data they are assigned to. It’s one of the things that I want to work on, with the help of my mentors after GSoC ends.
Panel/Context Menus
Another goal of my project was to facilitate the user interaction with the ground station by using context menus (the menus that usually appear when you right-click an application. The feature was introduced in the past few weeks and I’m pretty happy with it. For now, it holds basic features (hide charts, add/edit/remove elements, etc), but can be expanded to fit any needs that may arise in the future. It’s implementation is pretty straight forward and easy to add new features.
Final Overview of my work and GSoC 2018
Since I was the only one pushing to the repository during this period, my code can be easily seen by looking through the commits and filter with this time period. However, here’s a git diff that shows all the changed files.
What I did in the last 3 months (all documentation can be found in previous blog posts and the project’s wiki):
- A menu bar that holds many easy-to-access features, like loading protocols, hiding/showing panels, etc;
- Separated the 3 views with a Split Pane, for easier resizing;
- Implementation of a Layout system, where the user can have his own version of the ground station. Layouts can be persisted through a JSON file
- Implementation of the Layout Creator (a tool that eases the process of creating a layout)
- Created a system to assign data to UI elements easily
- Created the Assign Data Window, that shows all current states/charts and lets assign data points to them
- Implementation of panel menus
- Ability to add/remove/edit states directly from the main window
- Ability to add/remove/edit charts as well
- Updated project to Java8
- Small GUI tweaks
- Code cleanup of the overall project
- JavaDoc for all new class files as well as some missing methods from older classes
- Documentation of my work in the project wiki
- Updated out of date pages as well
- Blog posts to document my work throughout the event
What’s left to do
Even though Google Summer of Code 2018 has pretty much ended, my work towards this project has not. I gathered a list of tasks/issues that can be worked upon afterwards. These are:
- Update charts and states with the previously assigned data
- Change the way the application handles both configuration and protocol files
- Implement Drag and Drop functionality to add variables
- Fix States/Charts information not being displayed
- Other UI changes
Contact
Name: Pedro Portela (Portugal)
Field of study: Software Engineering @ ISEP
Email: pedro.portela@aerospaceresearch.net