Introduction
CubeSats is a class of nanosatellites that uses a standard size and form factor. The standard CubeSat size is one unit or 1U measuring 10x10x10 cms and is extendable to larger sizes; 1.5, 2, 3, 6, and even 12U. Originally developed in 1999 by California Polytechnic State University of San Luis Obispo (Cal Poly) and Stanford University to provide a platform for education and space exploration. The development of CubeSats has expanded its industry, academy, and industry with ever-increasing capabilities. CubeSats now provides a cost-effective platform for science investigations, new technology demonstrations and advanced mission concepts using constellations, swarms disaggregated systems.
While CubeSats came into the picture for it’s low cost of manufacturing with many small to medium sized individuals. So through this project.
Project Requirements
This project is made using python-3.x or python 2.7. Python libraries used for this project are
- scipy-0.18.1
- matplotlib-2.0.0
- Numpy-1.12.0
- PyQt4-4.11.4
Except for PyQt4 all other libraries can be installed using python package manager. Installation of PyQt4 depends on the distribution. Detailed guide for installation of requirements is available here .
Overview of Project
This project aims to provide a reliable open-sourced cubesats tracking following different mechanisms and protocols for transmitting signals that too using very low end receiver i.e Software Defined Radio (SDR) and under limited computation power for which no reliable satellite tracking facilities are provided.
As an input it takes output file of sdr (both .dat or .wav) plots waterfall displaying of the signal file showing signal present in different bands of frequency. Further, it applies bandpass filtering to remove undesired frequency and based upon the transmission mechanism used by the transponder on the satellite it follows appropriate tracking pipeline. Right now transponders following Automatic Packet Reporting System (APRS), Beacons or Automatic Picture Transmission (APT) is supported.
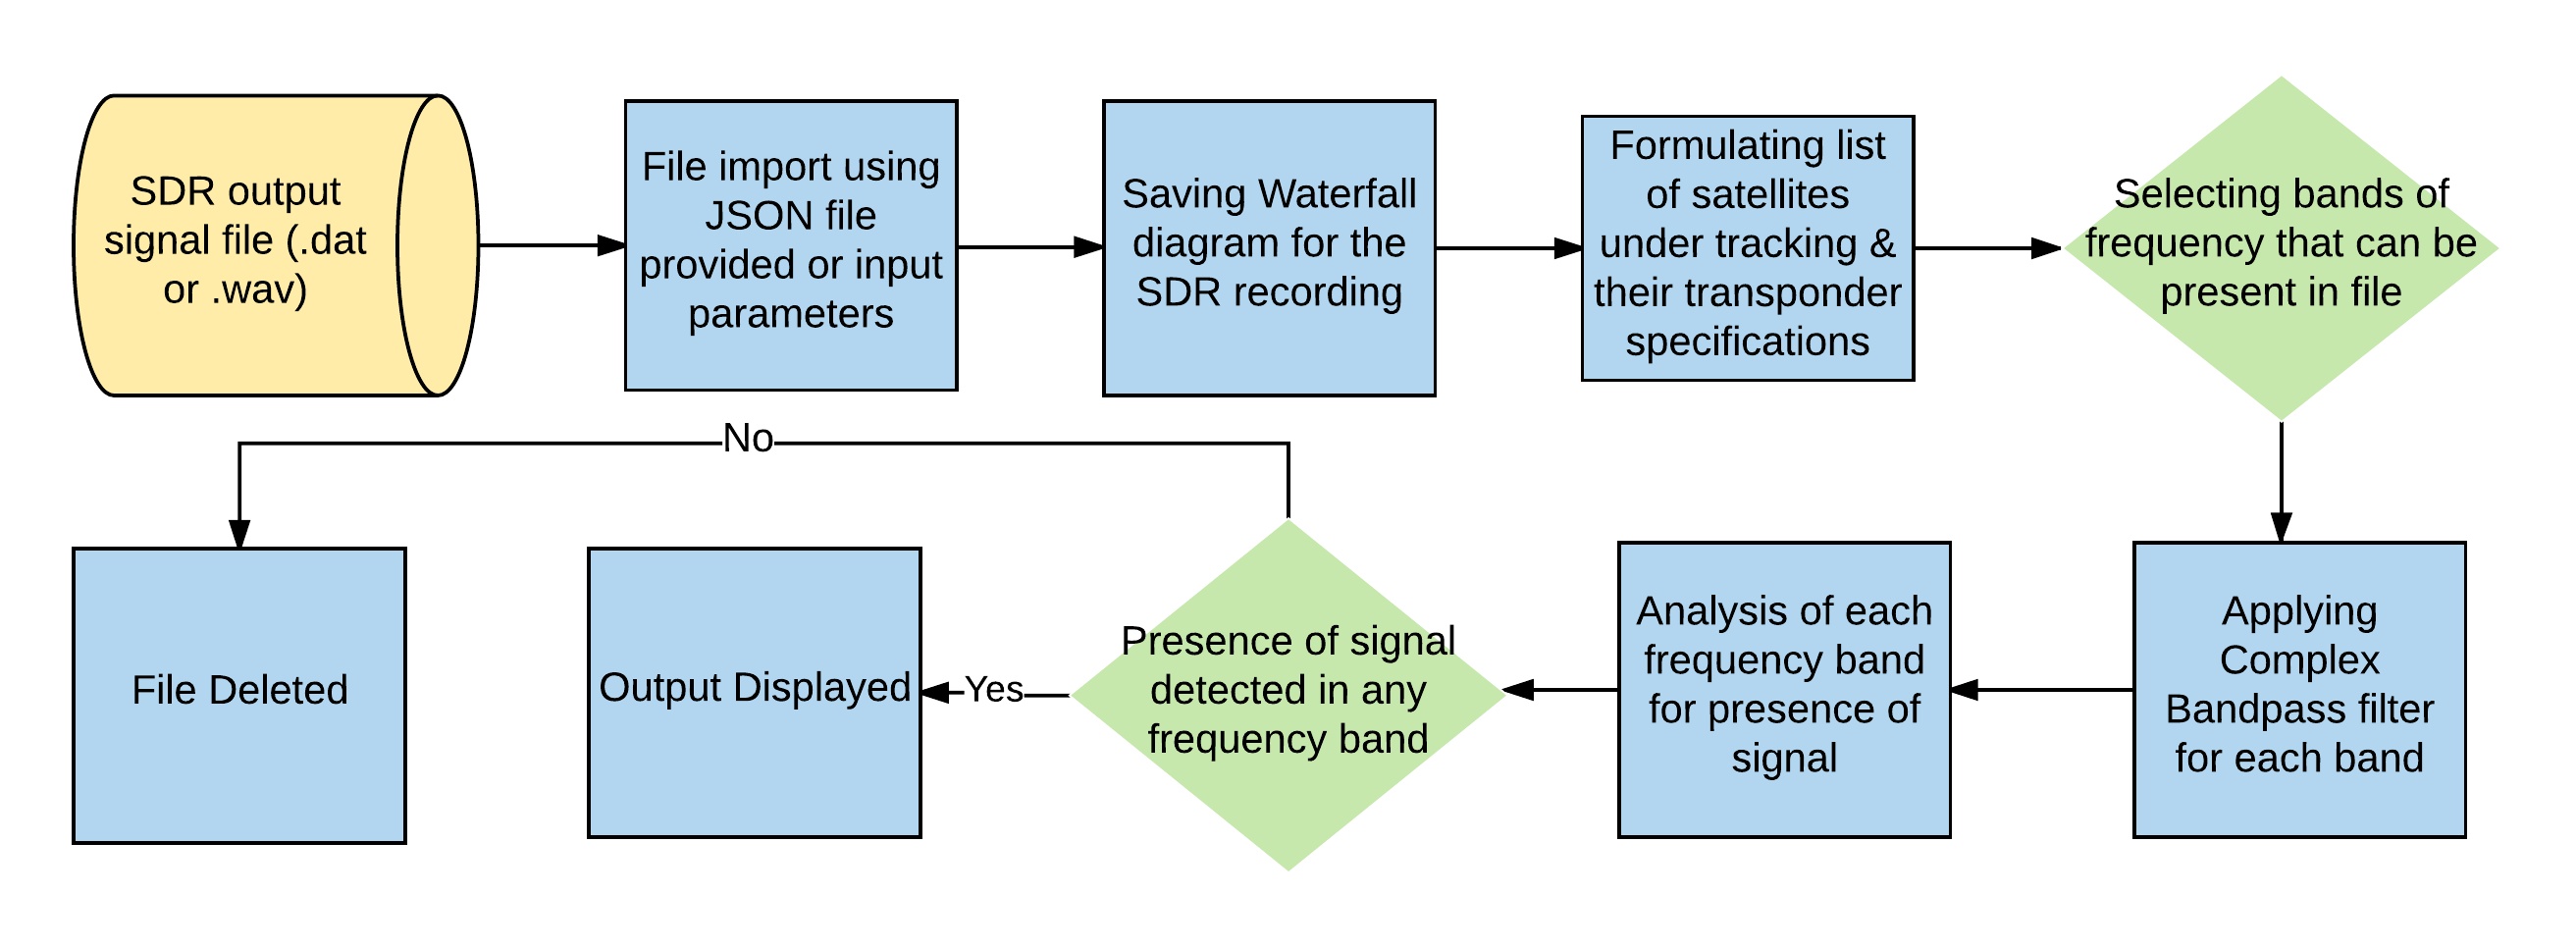
A bird’s eye view is shown in the above flow chart. Our whole pipeline can be sub-divided into 4 major units:
- SDR Recording Import
- Waterfall Diagram
- Formulating frequency bands & complex bandpass filtering
- Signal Detection
I) SDR Recording Import
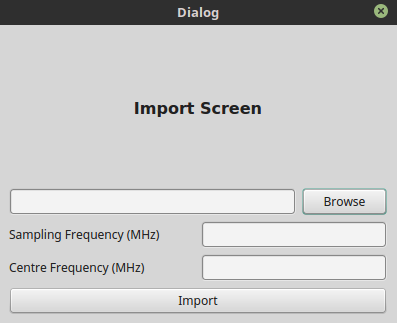
Our project supports SDR IQ signal recording in both file formats (.dat) as well as (.wav). File import can be done in two ways
-
Single File Analysis
Single file is select for signal detection.
-
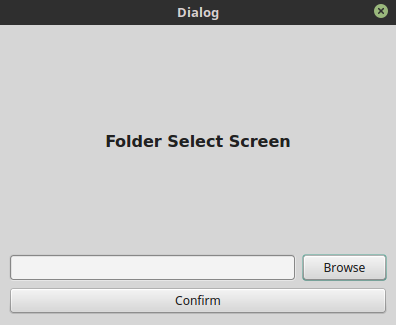
Folder Import
This is the server version of this project. To import metadata with file JSON file with the same name as file is required. Any new file added to the folder is also imported and analyzed automatically. Below image shows how to select
II) Waterfall Diagram
For each signal file analyzed a waterfall image is saved which shows visually presence of signals in different frequency bands as depicted in images below.
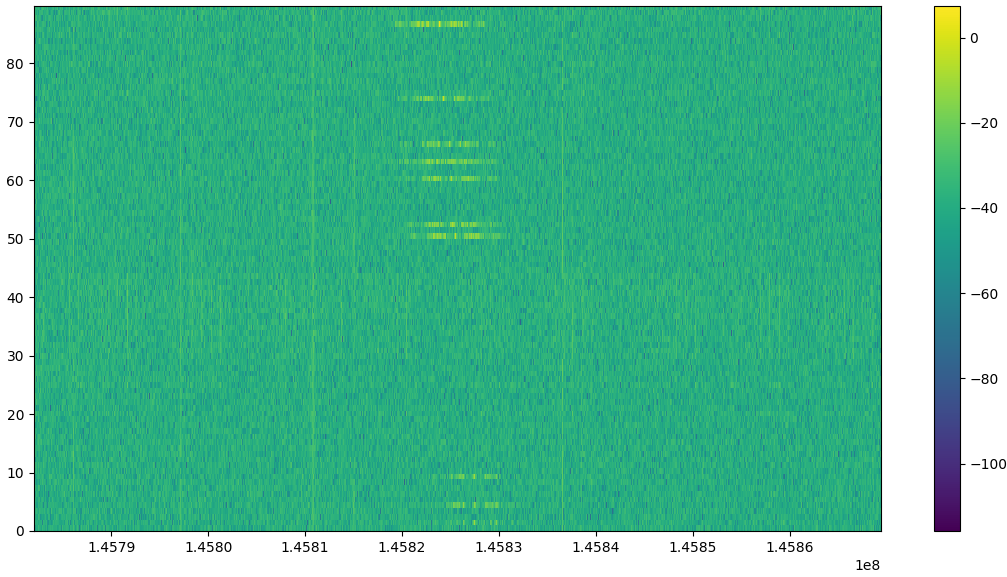
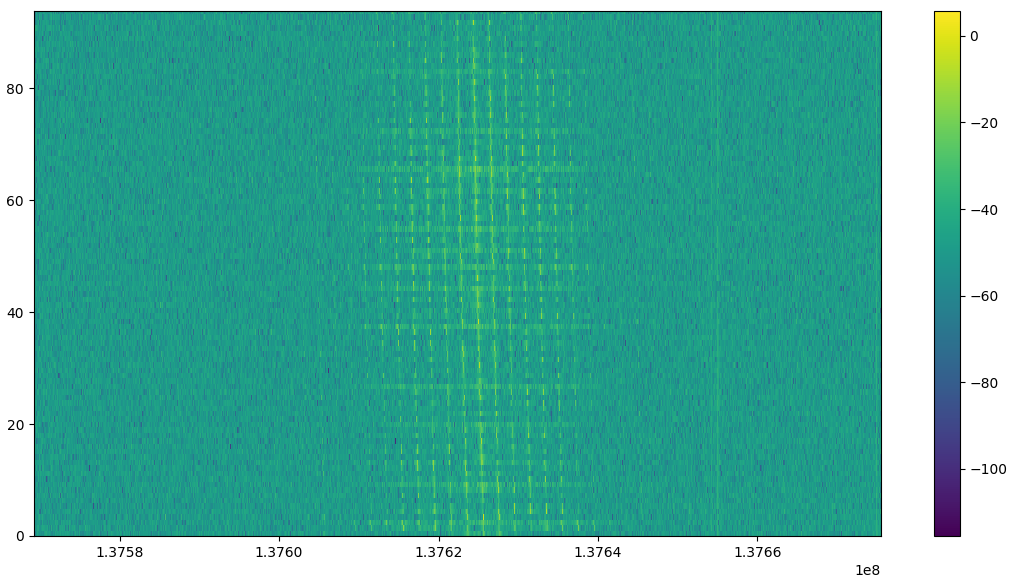
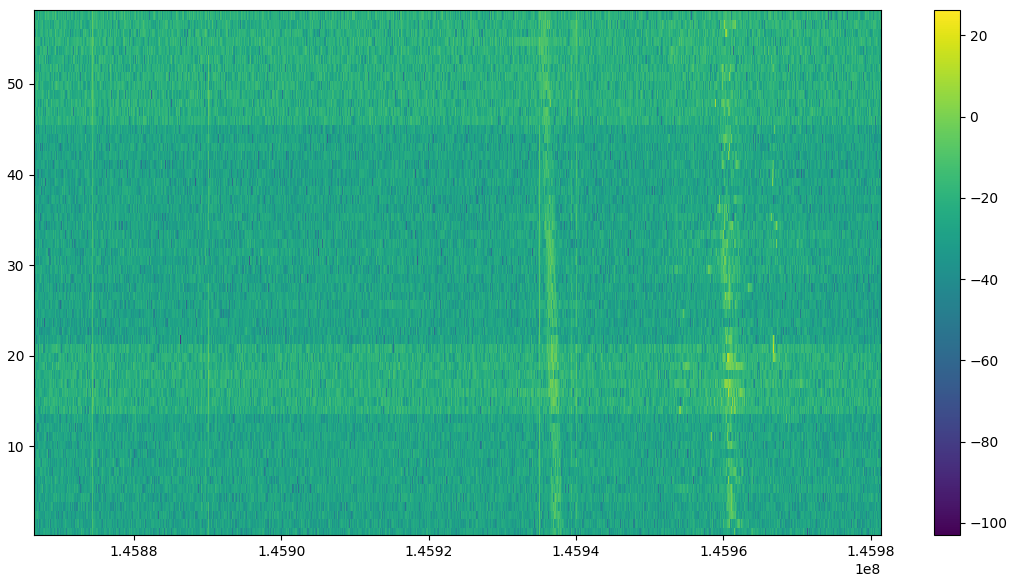
In the plots A1 one can see transmission made by ISS to it’s ground centre with time region of no transmission. In plot B1 we can see the presence of NOAA-15 frequency with doppler shifting. In plot C1 beacon type signal can be observed at small time intervals.
III) Formed frequency bands & complex bandpass filtering
After importing signal file along with the required meta-data, the program is used in JSON format, does doppler correction and selects those satellites whose frequencies can be present in the signal file. Based on the frequency bands of satellite complex bandpass filter for each band is constructed.
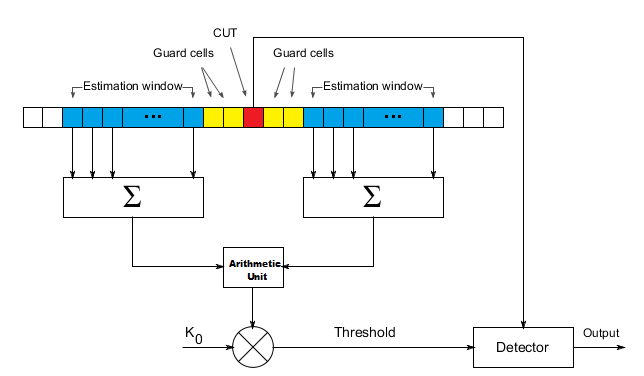
IV) Signal Detection
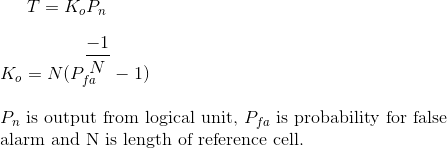
we calculate threshold values at each cell based on values from leading & lagging cells with some guard cells in between to prevent mixing of signal. Summation of both parts are calculated and sent to arithmetic unit which does further analysis. Then the output is multiplied by a constant & the logical unit detects the presence of signal. Mathematical expression used for this is,
Using the above technique we found the presence of APRS signal & beacon signal in file. Only difference lying in Arithmetic unit is explained below:
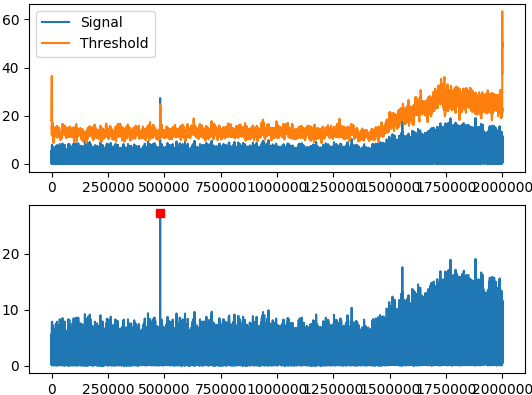
- Automatic Packet Reporting System(APRS): We subtracted summation of leading cells from lagging cells & looked for unusual sharp minima & based on that detector confirms presence of APRS signals. Below graphs shows performance of our model in recordings having low as well as high noise levels.
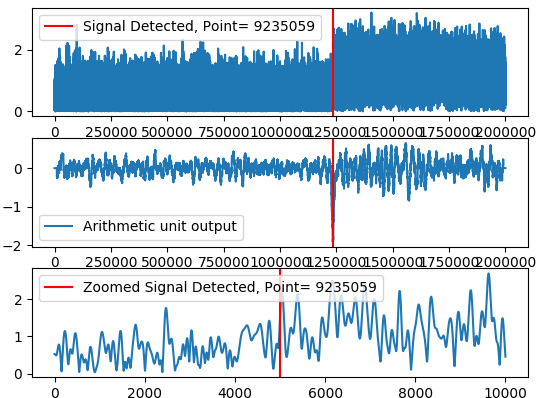
APRS signal in low SNR 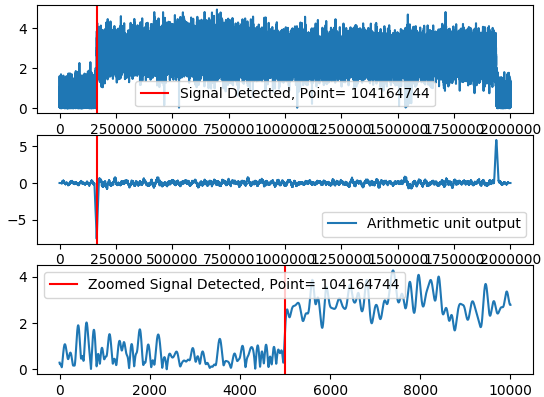
APRS signal in high SNR
-
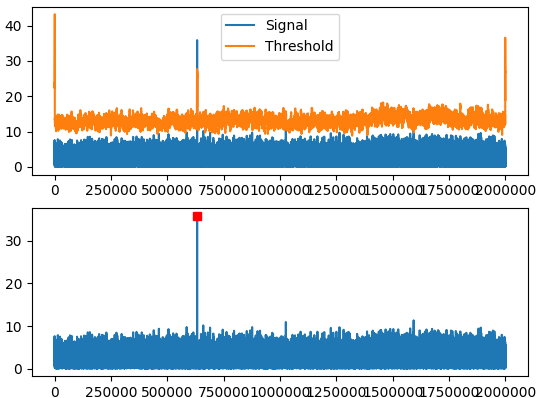
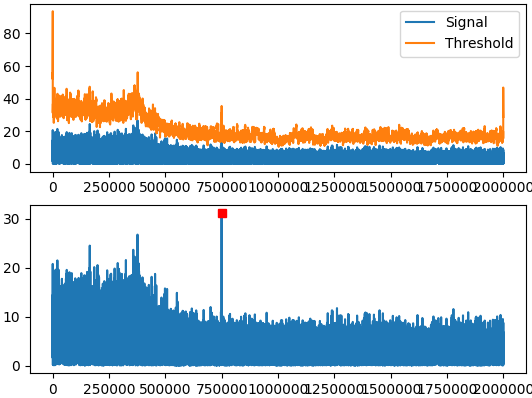
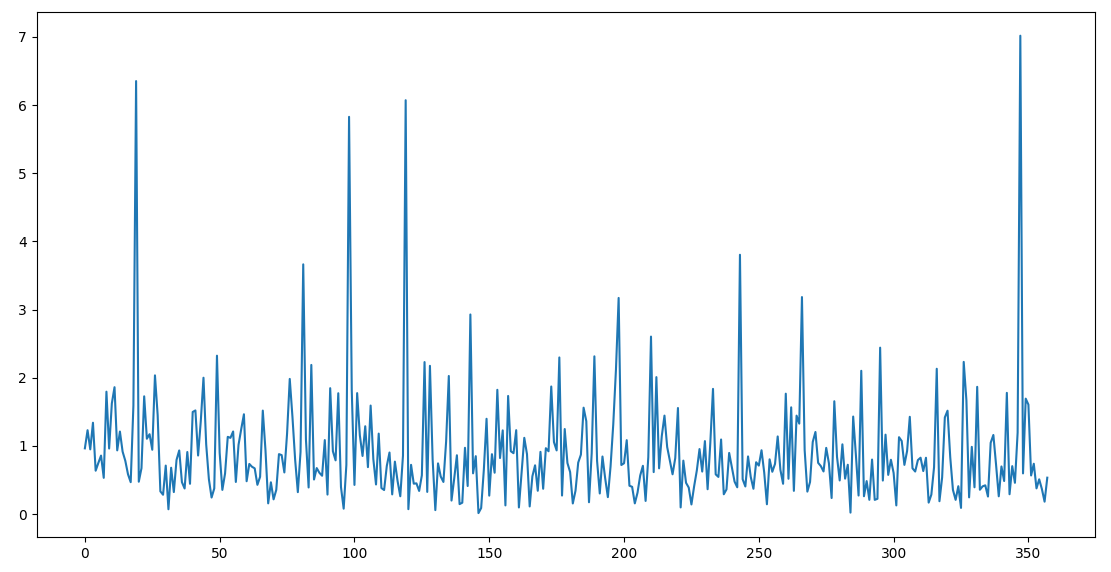
- Beacon: We took mean of leading cells and lagging cells & looked for points crossing the threshold & based on that detector confirms presence of beacon signals. Below graphs shows performance of our model around peaks surrounded by low as well as high noise.
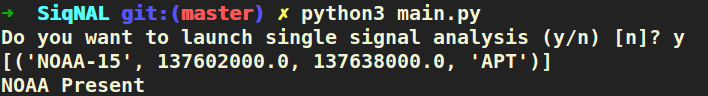
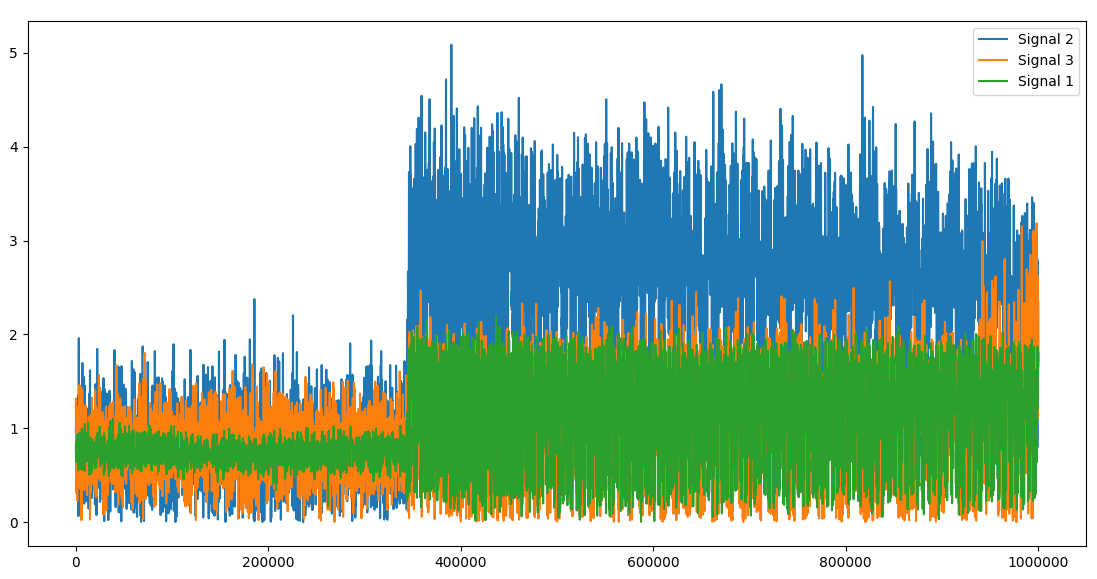
- Automatic Picture Transmission(APT) signals mostly used by NOAA satellites. These signal transmission is not discrete instead it is continuously transmitted by the satellites and whenever ground station is in range of satellite it can receive the signal. The first graph shows frequency band in which APT signals are present while the second one contains absence of APT signal.
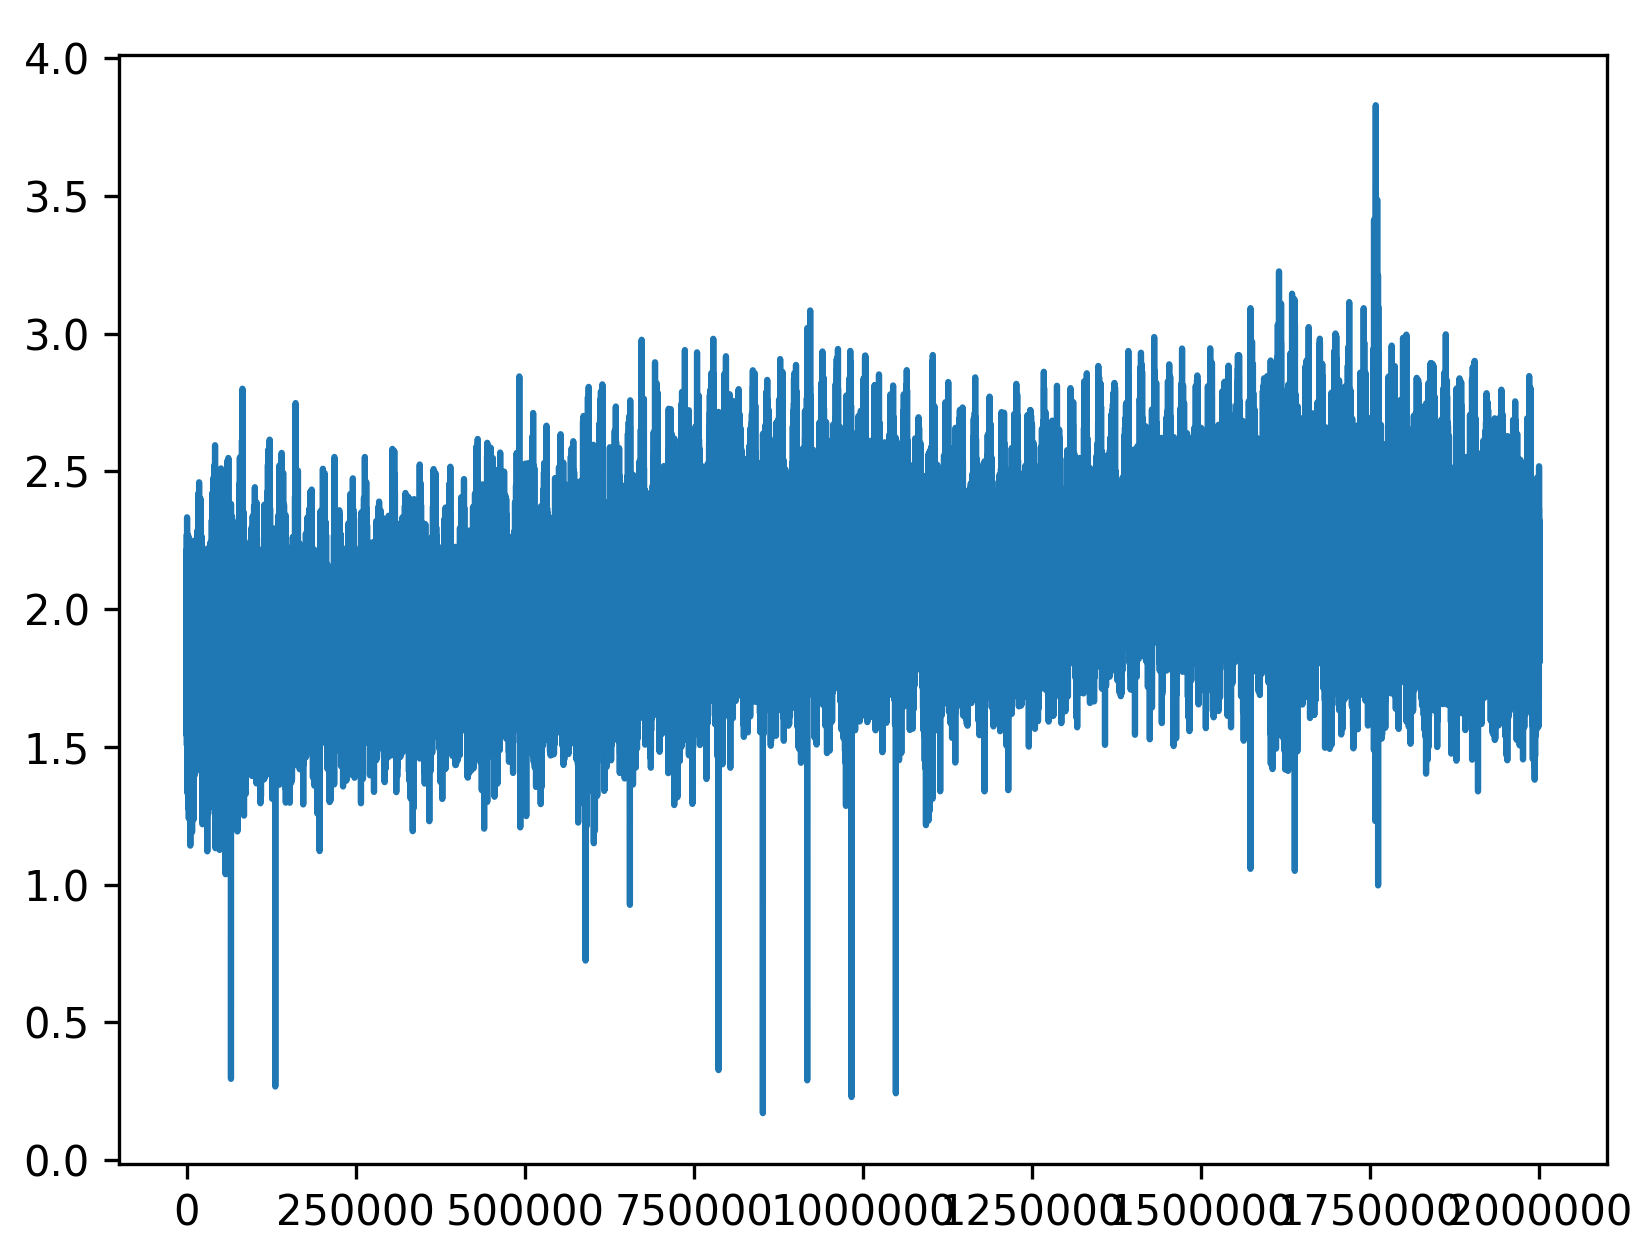
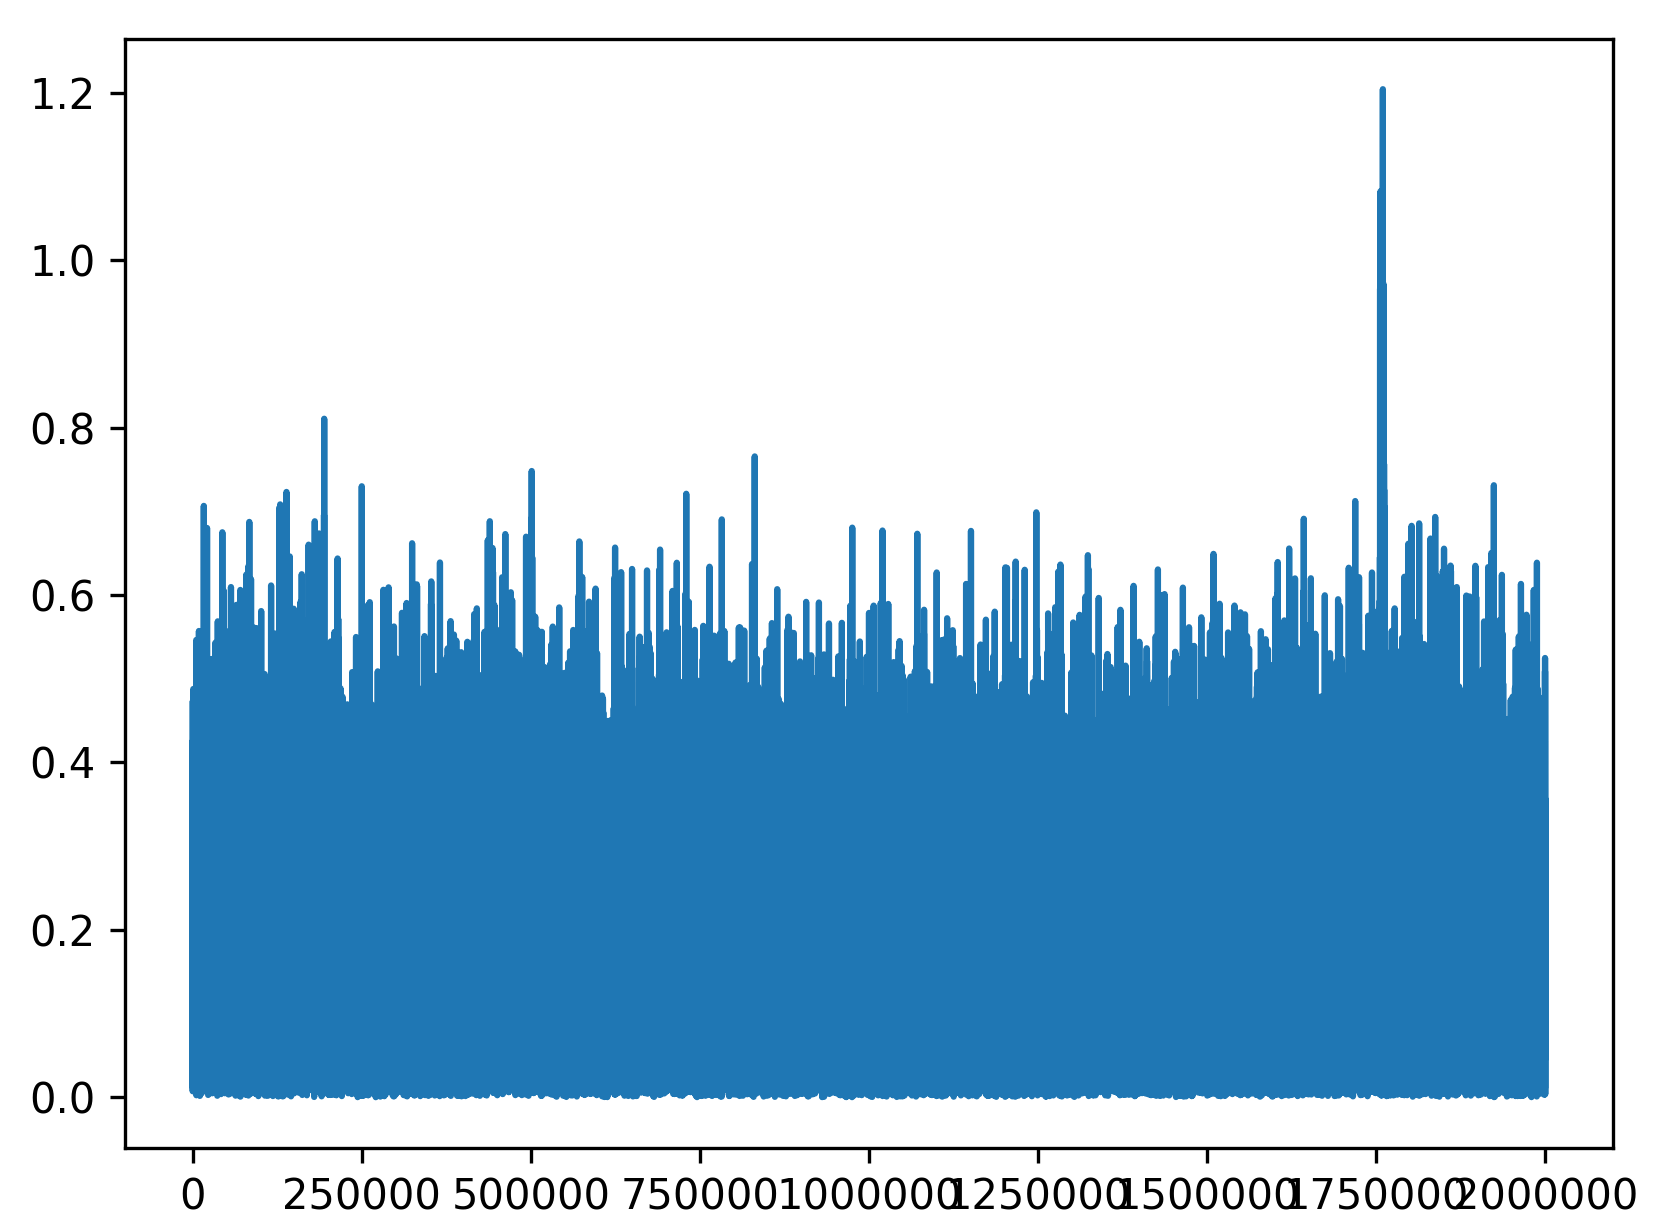
We can conclude that presence of APT signal due to continuous nature increases mean and median of the signal when taken in short time intervals as well as full signal file. Also standard deviation in the presence as well as absence of APT signals is small as in both cases deviation from mean is quite low. But standard deviation is almost comparable to mean in absence of APT signal as mean is itself small. Hence we calculated values for small time intervals of signal using formula below
![]()
Where threshold was calculated by,
![]()
Then around this threshold based upon distribution of points it is classified whether APT signals are present or not.
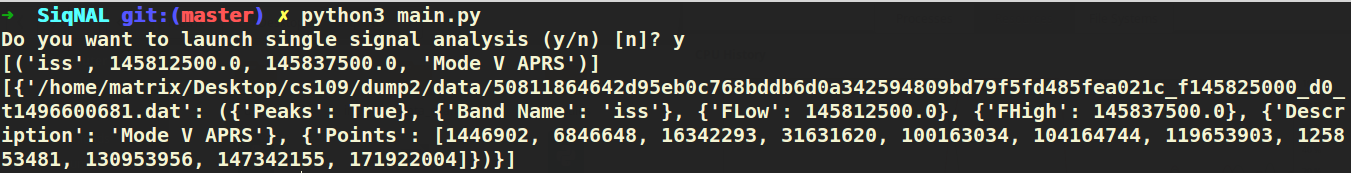
Outputs
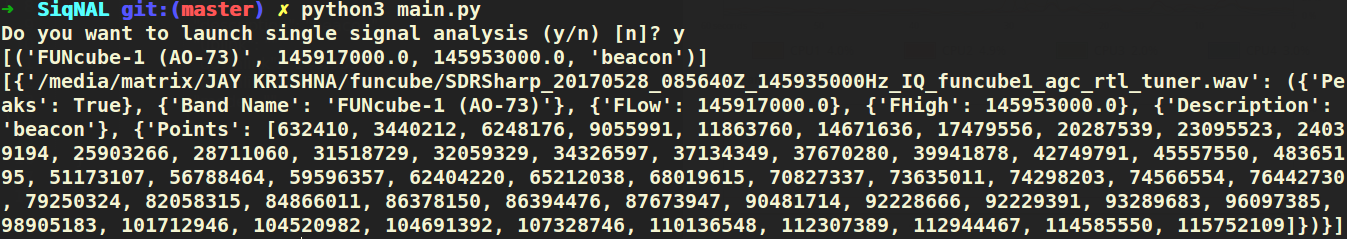
Below are the screenshots of output on terminal of Funcube, iss & NOAA respectively. Only that frequency band is include in which presence of signal is detected.
Future Work
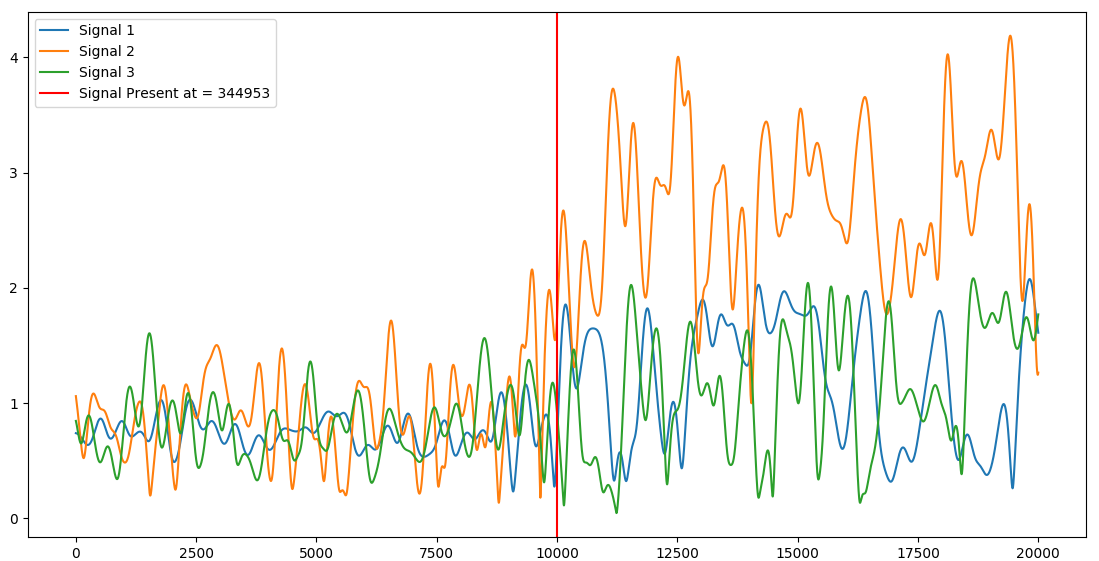
This project can be taken further ahead by usage of normalized cross-correlation of signals captured using different SDR’s. We tried this approach but the major problem we faced was colored gaussian noise instead of expected white gaussian noise. Also clocks of all SDR’s need to be synchronized so that we will perform correlation without using time lagging signals.
The above graph is obtained after doing normalized cross correlation on APRS signal & the points we got after all where lying in between zones where signal was present but due to presence of colored noise as well as asynchronous clocks it was difficult to find point of start of signal.
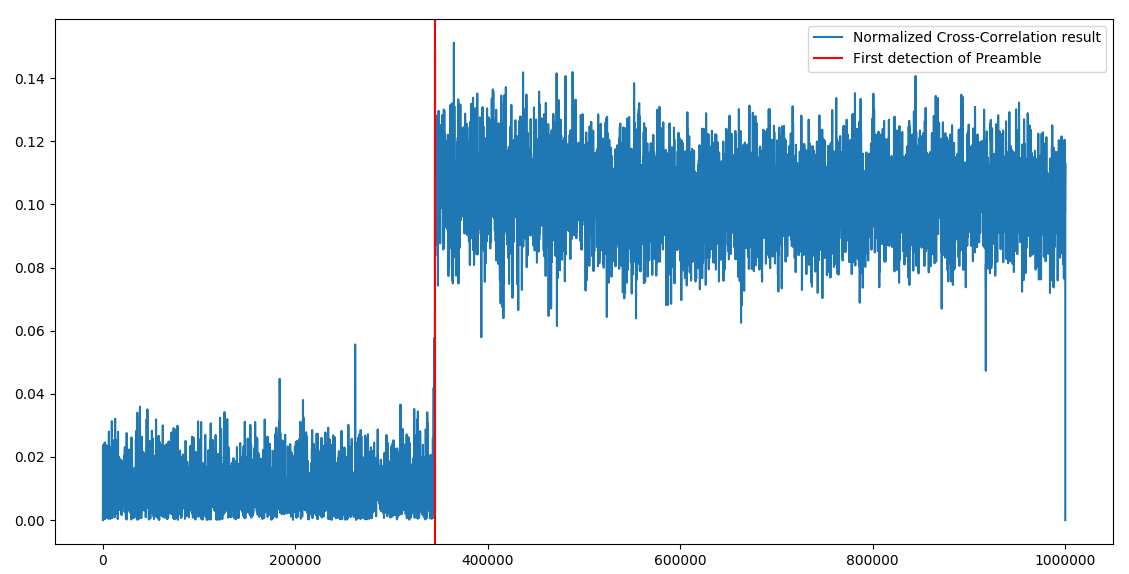
Another approach which can be used for the preamble of preamble. Following graph shows the result of normalized cross-correlation search result & zoomed.
Acknowledgment
At the end I would like to thank Aerospace Research for giving me opportunity to work with them in Google Summer of Code 2017 and I would also like to thank Andreas Hornig for being the mentor of this project & Extending his help whenever needed.