Hello everyone!
A little introduction since this is my first post: I am Vinay, an Electronics and Communication engineering student from IIIT Bangalore, India. I am working for AerospaceResearch.net under the Google Summer of Code (2018) programme. This organization was among very few organizations that caught my eye, owing to their very interesting projects in my fields of interest. I really believe in the core ideas of this organization, which is a great motivation for me. So far, it has been a great experience working on my project under the mentorship of Mr. Andreas Hornig.
This blog post will look at how synchronisation signals are being detected in the NOAA APT transmissions accurately.
DirectDemod
The project that I am working on is called DirectDemod [2], it is a set of libraries (written in python3) that will help people to easily deal and work with radio signals, especially the ones captured from RTL-SDRs. In these past two weeks, I have been working on demodulation of NOAA APT transmissions to extract the images, with a main focus on extraction of synchronization signals within. Accurate extraction of these sync signals would enable the DGSN stations to compare the time delay of arrival of the same signal at different ground stations, which will help in triangulation of the position of the satellite. Thus, tracking it as it goes around the globe. My main aim is to get the sync locations within the signals as accurately as possible, which will increase the accuracy of the triangulation.
The NOAA APT signal
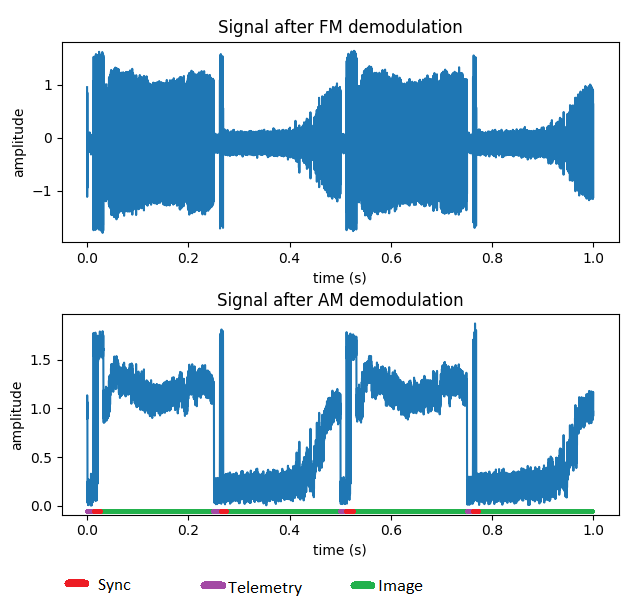
A little introduction about how the NOAA APT signal looks like: The NOAA APT signal [3] has three main sub-signals: (a) The Image part (b) Synchronization part (c) Telemetry data. The signal actually contains two image channels A and B sent alternatively, but for the purposes of this blog we generalise them as one. The signal is first amplitude modulated over a 2400Hz carrier. Then frequency modulated on a higher carrier e.g. 137.62 MHz. Hence to demodulate the signal we have to first FM demodulate it then AM demodulate to get the signal back. An example waveform is shown in Fig. 1. We FM demodulate using I and Q channels in the signal capture file then AM demodulate to get our main signal. It is within this signal we would like to detect the location of sync (shown in red in Fig. 1)
Synchronisation signal
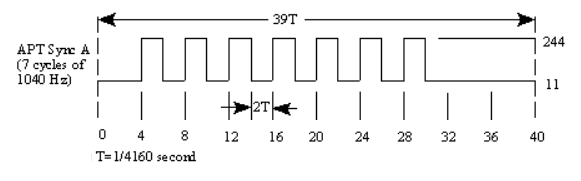
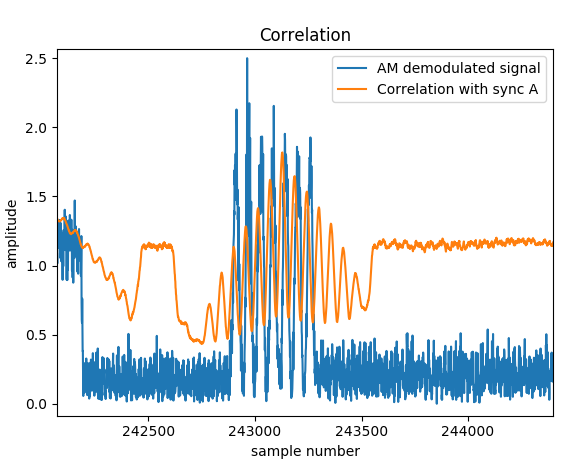
One can observe that the correlation peaks when the sync is in perfect alignment with the signal. We just have to detect the location of these peaks, which will be the location of syncs within that signal.
Correlation
We tried two kinds of correlation,
(a) Scipy’s correlation: For this to work we would need the sync signal (needle) to go from -0.5 to 0.5, this is because the amplitude of both signals is not the same. [5]
(b) Normalized correlation: This method inherently normalizes the signals hence we can use an all positive sync signal for correlation. [6]
Results
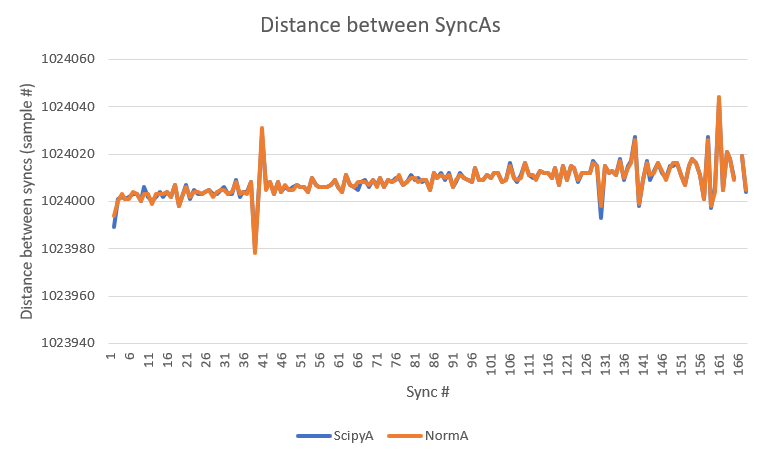
Both methods were used to find syncs within the signal, Ideally the difference between the consecutive location of these syncs should be 0.5 seconds or 1024000 samples (0.5 * 2048000 sampling rate). The graph in Fig 4. shows that we get a very good result. Also we find that both the results give almost the same result with very little variation. One can also observe a slight slope in the results, this can be due to the Doppler effect.
The disadvantage of using Normalized correlation is that it is computationally expensive. A complete execution of sync detection on a 300 Mb file takes about 4 minutes using Normalized correlation whereas Scipy’s correlation takes about 2 minutes for the same file.
Challenges faced
- Due to memory constraints, the input file had to be processed in chunks. Methods had to be researched to keep the flow maintained between chunks, be it use of filters, demodulators etc. (Look at experiments [7] for further detail)
- Filters introduce a certain phase shift (delay) this was to be avoided to get absolute sync positions in the signal (Experiment 3 at [7]).
- Python is an interpreted language, hence slower than compiled languages like C. Proper care was to be taken to use Numpy’s functions to speed things up. (Look at experiments [7] for further detail)
DIY
If you want to replicate the results, make sure you have the requirements installed: Python3, scipy, numpy. Then just clone the repository at (https://github.com/aerospaceresearch/DirectDemod/tree/Vinay_dev) and run ‚python noaa_cli.py IQ.wav‘. The documentation for the same is available at https://directdemod.readthedocs.io/
References
- https://sourceforge.isae.fr/projects/weather-images-of-noaa-satellites/wiki
- https://github.com/aerospaceresearch/DirectDemod/tree/Vinay_dev
- https://en.wikipedia.org/wiki/Automatic_picture_transmission
- https://en.wikipedia.org/wiki/Cross-correlation
- https://docs.scipy.org/doc/scipy/reference/generated/scipy.signal.correlate.html
- https://anomaly.io/understand-auto-cross-correlation-normalized-shift/
- https://mybinder.org/v2/gh/aerospaceresearch/DirectDemod/Vinay_dev