We got important stuff done in weeks 3 and 4. Everybody knows that visuals and graphics are very important for presentation purposes. The most popular library for plotting is matplotlib. It can generate excellent plots but in the end, they are static images. Instead of static images it’s better if some interactive content is presented. So we decided to make a webapp for OrbitDeterminator. A webapp makes it easier for the end-user to run the program. It can also be hosted on a publicly-accessible server, which means that anyone can use it without going through the pain of downloading and installing the program. For making the webapp, my mentor Alexandros suggested the excellent Dash library by Plotly.
Dash by Plotly
Dash is a Python library that can be used to make web applications. The library is built to be hosted on a server and be used by multiple people at once. It is powered by Plotly which produces beautiful, interactive plots in the browser itself. Programming in Dash is simple. First, you have to define the layout of the app in the form of a list of html components. You can style them as you like or add additional parameters. After this, you have to define callback functions. These functions will be triggered whenever the user interacts with the UI (like pressing a button, or typing some text). These functions can be used to change the elements displayed on the app. This makes the app interactive.
Designing the app
For now, OrbitDeterminator’s primary function is to find a good set of orbital elements that match a noisy set of observations. The webapp will be a graphical way to do this. Observations are stored in CSV files in the following format:
# Comments
# here.
#
# t x y z
<time_1> <x_1> <y_1> <z_1>
<time_2> <x_2> <y_2> <z_2>
...
<time_n> <x_n> <y_n> <z_n>
So the webapp must have a place to upload csv files. We also want to show the name of the file and the file contents in case the user has uploaded the wrong file. And of course, we have to show the results and plots of the results. After discussing with Alexandros, I settled on this layout:
- File upload box
- File name and contents
- Keplerian elements
- Spatial plots
- Ground track
- Coordinate vs time plot
- Residuals plot
But the user might not require all this information at once. So all the components must be collapsible, to hide them from view if not required. Making the webapp required lots of googling but was relatively easy. The end result is this:
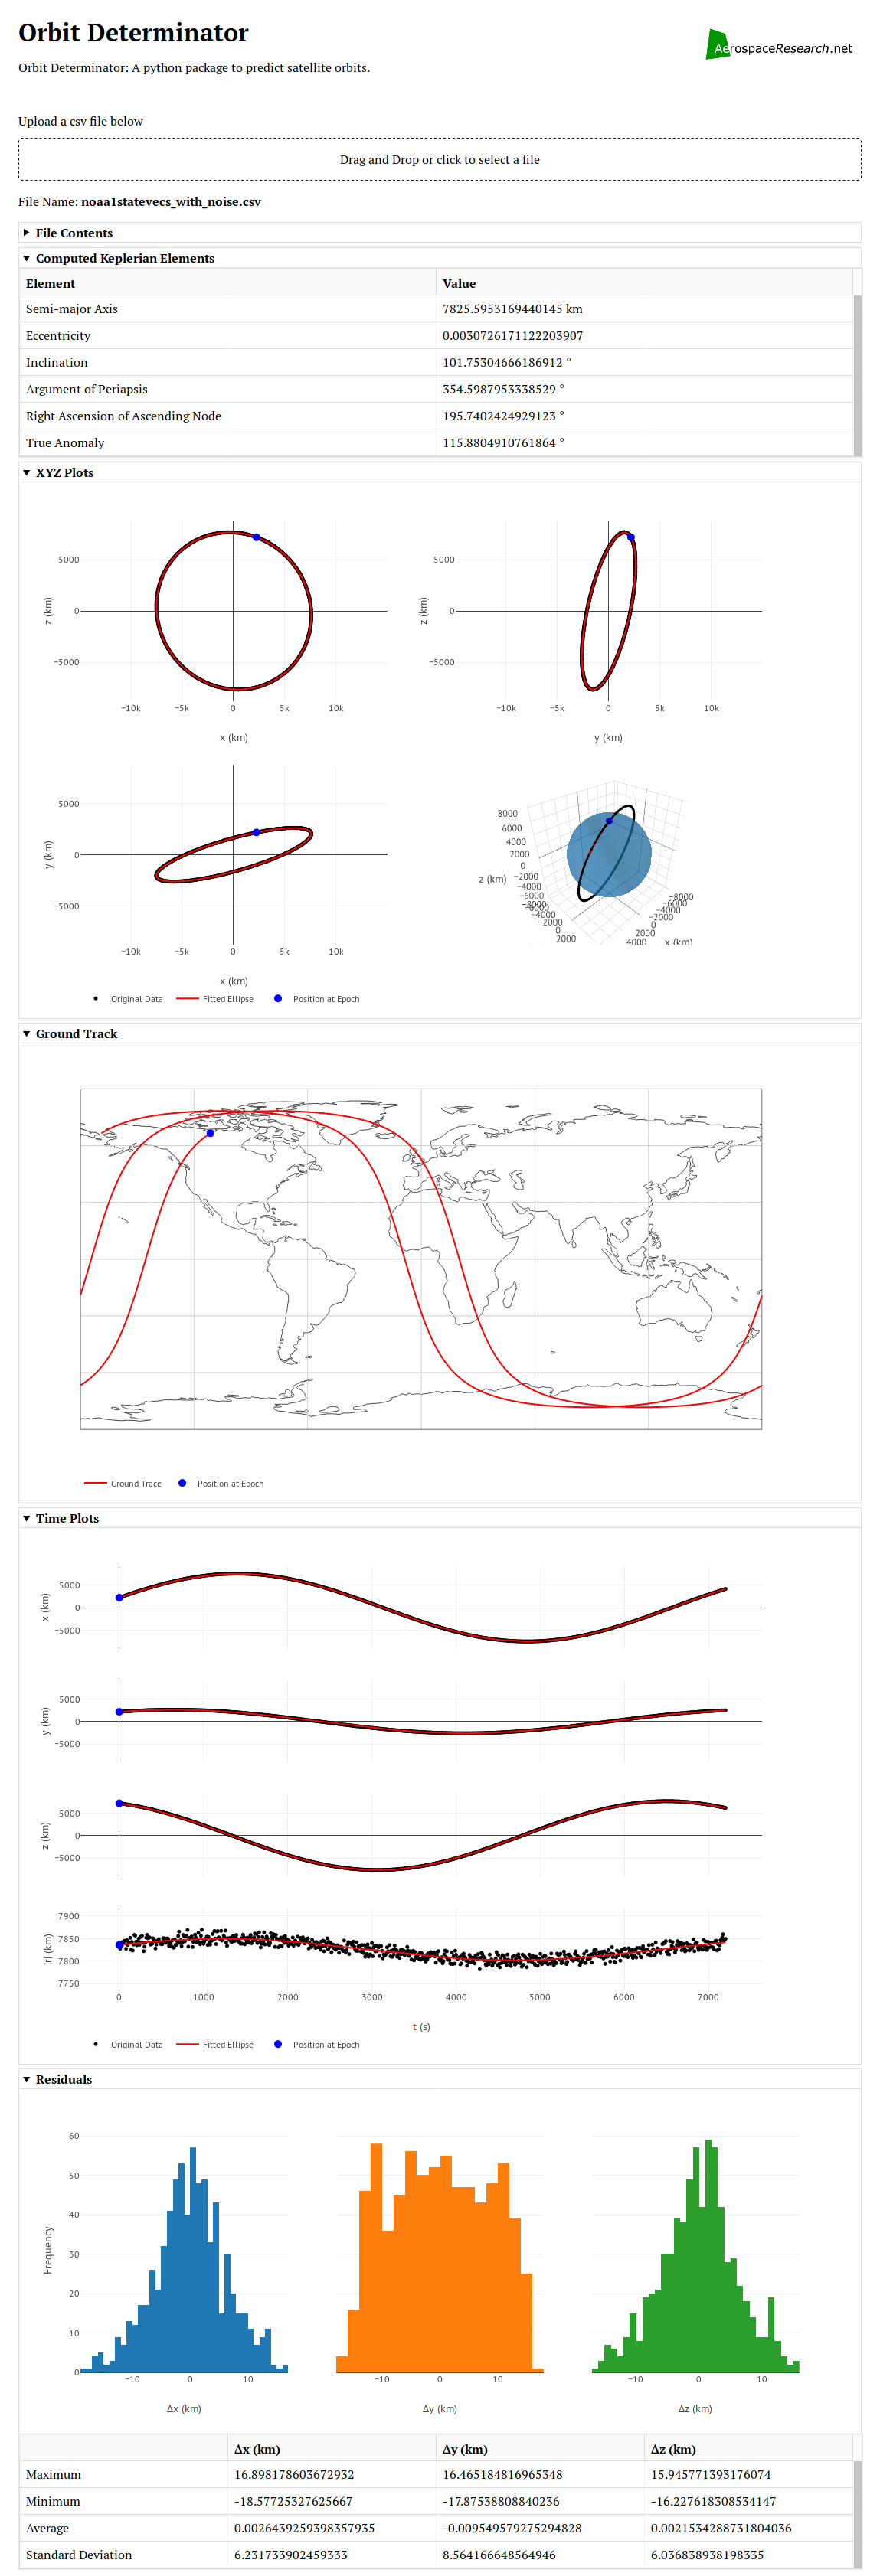
All the plots are interactive. You can zoom, pan, and rotate them. You can also save any plot you want as a png file. Most of the plots were straightforward. The most difficult plot was the ground track, whose algorithm I will discuss below.
Plotting the ground track of a satelllite
To plot the ground track, we have to know the position of the satellite with respect to the Earth’s surface. First, I thought that just converting the coordinates into polar form and plotting φ vs θ would do the job. But I forgot that the satellite coordinates were measured with respect to an inertial (fixed) reference frame, whereas the Earth’s surface is rotating. So the actual coordinates will be different. I went through two articles on CelesTrak and Astronomy StackExchange to come up with the algorithm.
NORAD uses True Equator Mean Equinox (TEME) reference frame for its TLEs. In this frame, the origin is at the Earth’s centre. The z-axis points toward the North Pole. The x-axis points to the vernal equinox. And the y-axis completes the right-handed coordinate system.

We need to convert coordinates in TEME to an Earth-Centered-Eath-Fixed (ECEF) reference frame. In such a frame, the origin is at the Earth’s centre and the the coordinate axes are fixed to the Earth’s surface (which means that they rotate along with the Earth). Many such frames exist but the standard one is the International Terrestrial Reference Frame (ITRF). In this frame, the z-axis points toward the North Pole, the x-axis points toward 0°E 0°N. And the y-axis completes the coordinate system. Since both TEME and ITRF share a common z-axis, the latitude will not be affected. Only the longitude will be shifted by a certain amount. This amount, known as the Earth Rotation Angle, is the angle between TEME’s x-axis and ITRF’s x-axis. Now I will write down the pseudocode I used to determine this angle.
Let t be the time at which we want to find the Earth’s rotation. Let t_mid be midnight on the same day, so that t - t_mid is the UTC time during the day. Let J2000 be the time Jan 1 2000 12:00 pm UTC(this is the J200 epoch). Then the pseudocode is:
days_since_J2000 = t_mid - J2000
# multiply the above by an appropriate
# constant to convert the units into days

# centuries since J2000
Tu = days_since_J2000/36525

# effects of precession of the Earth's axis
tg0h = 24110.54841         +
     8640184.812866 * Tu   +
           0.093104 * Tu^2 -
           6.200e-6 * Tu^3

# Greenwich Mean Siderial Time in seconds
tgt = tg0h + 1.00273790935 * (t-t_mid)

# rotation angle in degrees
rotation_angle = (tgt%86400)*360/86400
After getting the rotation angle, we can subtract it from θ to get the actual longitude.
Putting everything together , we get this plot of the ISS for 21st May 2018 18:27:54 UTC. I used this NASA website to generate the NASA ISS plot.
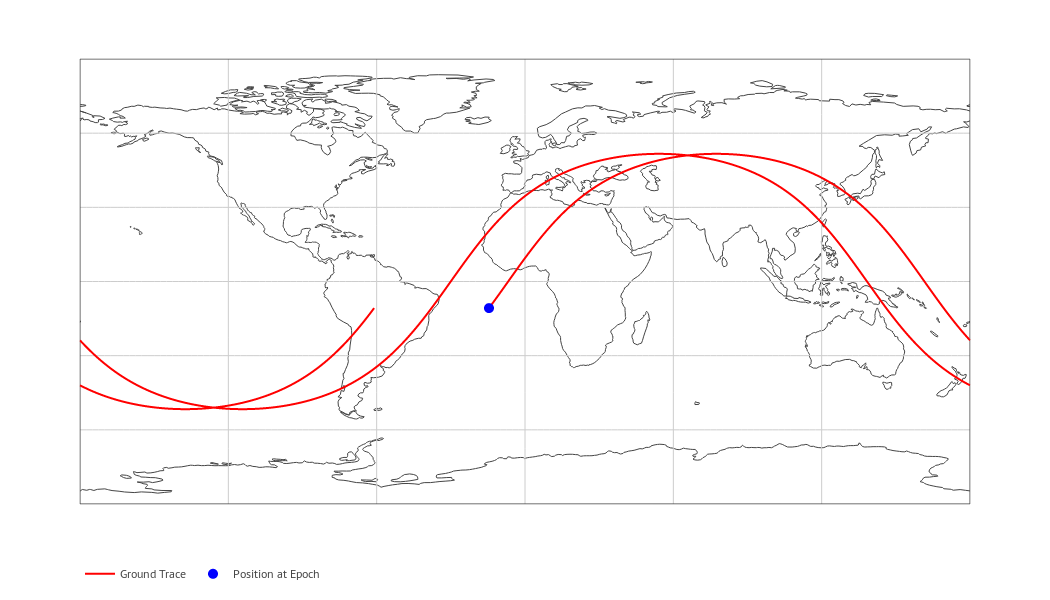

As you can see, the results line up pretty well. Note that this is a simplified model and is not super-accurate, but it gives roughly the same results.
Future Work
- Integrating the SGP4 model into OrbitDeterminator.
- Making a DGSN simulator (this will be used until the real DGSN starts working).
- Making a Kalman filter to combine the two sources of data.