[GSoC2019|DirectDemod|Vladyslav M] Final Blog Report

In this blog, I will summarize all the work, that has been done during my three months of work at AerospaceResearch.net.

The resulting product is a fully functional web application and a set of supporting logic, that allows uploading, georeferencing, combining and displaying NOAA weather images. Below, more specific features are listed.

Work done

  • implemented functionality to extract and store satellite metadata
  • designed and implemented an accurate image georeferencing algorithm
  • designed and implemented an algorithm to merge several satellite images, taking care of overlapping areas
  • created CLI interfaces for each part of package API
  • implemented generation of web map and virtual globe
  • built custom web application, which includes web server backend with Flask and frontend
  • deployed the working application to the web (demo version at http://206.81.21.147:5000/map)
  • wrote tests, documentation, installation instructions and usage tutorials

Links to work

Getting started

For installation please see the installation guide in the repository description. To start using specific features please refer to the tutorials page, it contains usage examples with corresponding sample files for each use case. If you want to know more about how the software is working, please read my blogs. They describe in sufficient detail how the software is working.

Further work

  • Set up automatic data uploading from recording stations.
  • Set up a DNS domain.

Support

If you have any questions or issues concerning the usage of the software you can ask for help / open issues on GitHub or contact me directly.

[GSoC2019|DirectDemod|Vladyslav M] Web application.

This blog post will describe in general terms the architecture of web application,  main steps of deployment process, processing server and several additional features.

General App Architecture

The application is an end-to-end data processing pipeline starting from raw satellite signal recordings and ending with displaying of combined images on the map or virtual globe. The image below describes this in a more structured way. 

Figure 1. App architecture.

As showed on the image, the app consists of 4 main parts: 

  • Recording stations
  • Processing server
  • Web server
  • Frontend

Data is being passed along this processing chain. Functionality of each part will be described in following parts of the article.

Processing Server

The task of processing server is to gather the raw satellite signal recordings and transform it to georeferenced images. This transformation happens using directdemod API:

  1. DirectDemod decoder extracts the image from recording.
  2. Image is preprocessed, two channels are extracted.
  3. Each part is georeferenced and saved.
  4. Processed data is being sent to web server.

Server uses ssh connection to securely transmit data, namely scp command is used. SCP stands for Secure Copy, it allows secure transmission of arbitrary files from local computer to remote machine.

Web Application

Web application is implemented using Flask. Web server has the following structure:

Figure 2. Web server.

It contains two main directories images/ – stores uploaded georeferenced image and tms/ – stores Tile Map Service representation of processed images. Images could be uploaded in two ways, either via ssh or throught /upload page (could be removed in production for safety reasons). After upload is done and the images are properly stored, then server will automatically merge this images using directdemod.merge and create TMS, which will be saved in tms/ directory. After processing is done, metadata will be updated and  images will be displayed on website. Website itself contains 3 pages:

  1. map.html
  2. globe.html
  3. upload.html (may be removed)

Map page displays images on Leaflet webmap, globe page uses WebGLEarth library to display images on Virtual Globe.

Should be noted that final implementation is somewhat different then showed on figure 2. Ability of viewing different channels was added, therefore tms stored in 2 directories corresponding to each channel.

Figure 3. Image of second channel.

Another major feature is called „Scroll in time“. Images are stored in chronological order and could be viewed sequentially using special slider. For each entry both channels could be viewed using a toggle button.

Deployment

Application has been deployed to the web http://206.81.21.147:5000/map. Appropriate domain name will be set up shortly.

Conclusion

This is the final part of the GSoC project. All main functionality and features have been implemented, web application is up and running.

[GSoC2019|DirectDemod|Vladyslav M] BigImage and BigGlobe.

This blog post will cover the process of visualization of NOAA images, specifically we will talk about general visualization pipeline and different ways to visualize satellite imagery, including creating interactive web maps and virtual globes. 

Visualization pipeline

We shall start from the very beginning. NOAA satellites constantly scan the Earth’s surface and then transmit it as a radio wave signal. This signal is captured by SDR (Software-defined radio system) and saved in wav format. Next step is dedicated to decoding this signal, i. e. finding sync signals, extracting and decoding an image line-by-line.

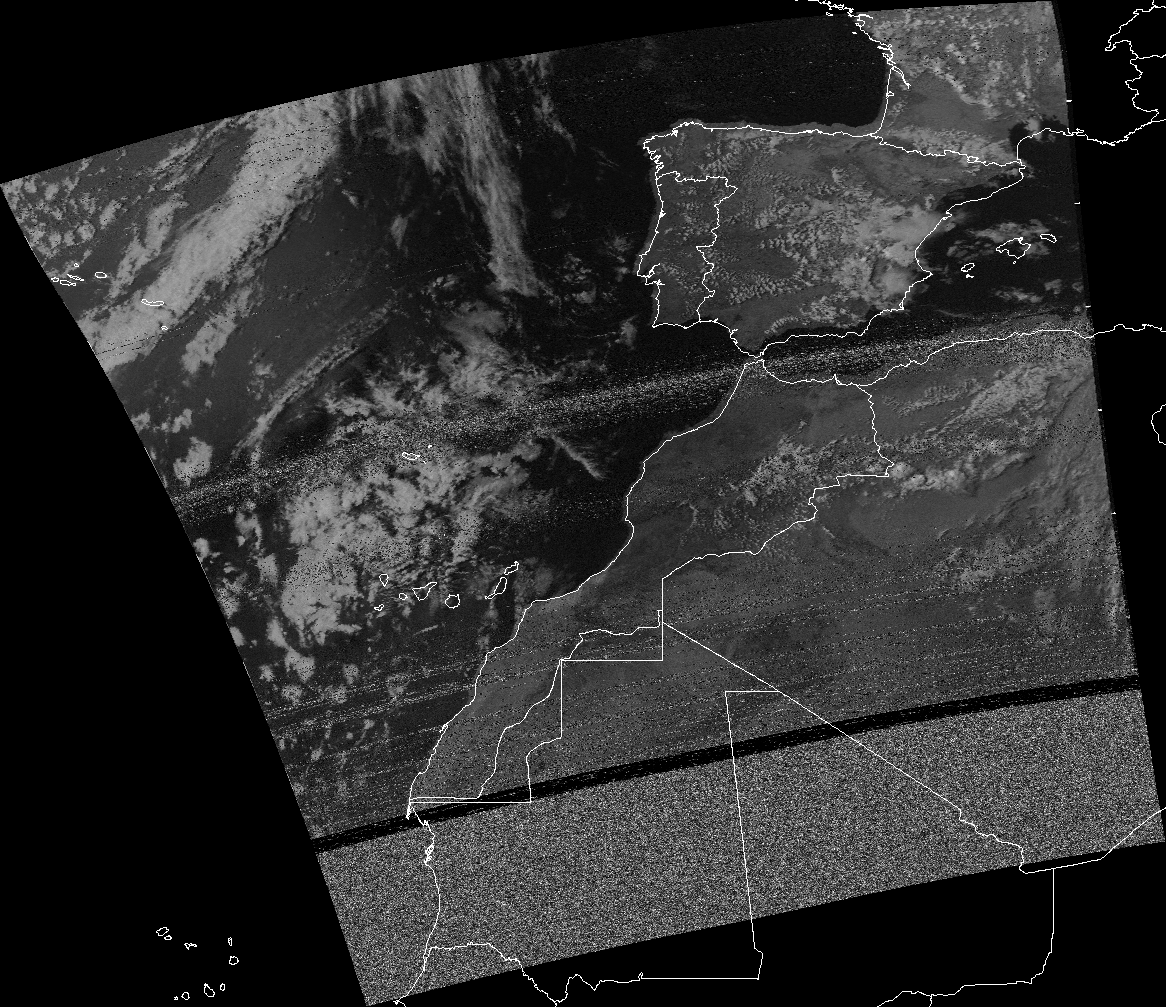
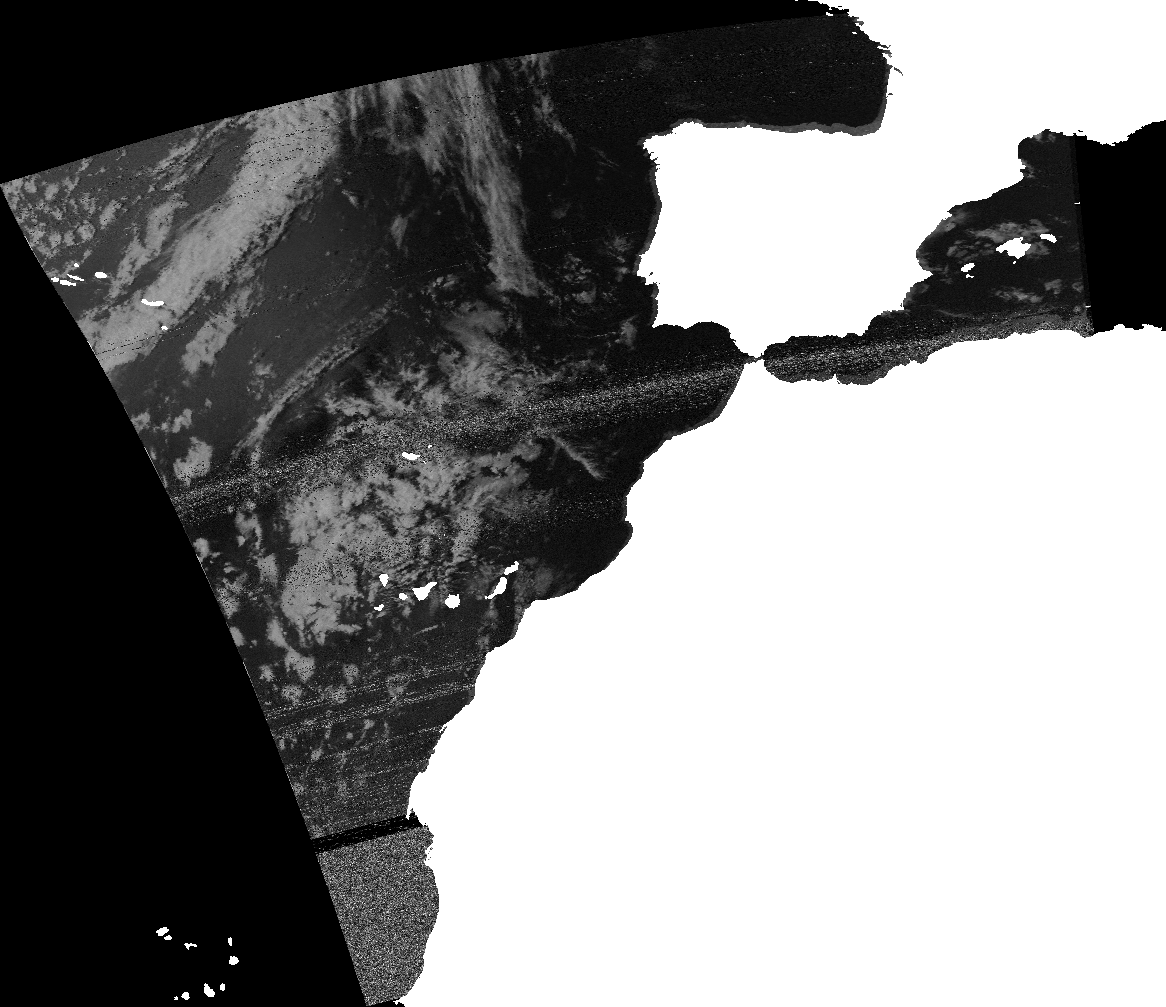
The decoded image includes both sync signals and 2 variants of the scanned image (in different color schemes), therefore it requires one more preprocessing step, where it is being cropped and rotated. Next two images are the results of this step, they will be used as an example for visualization.

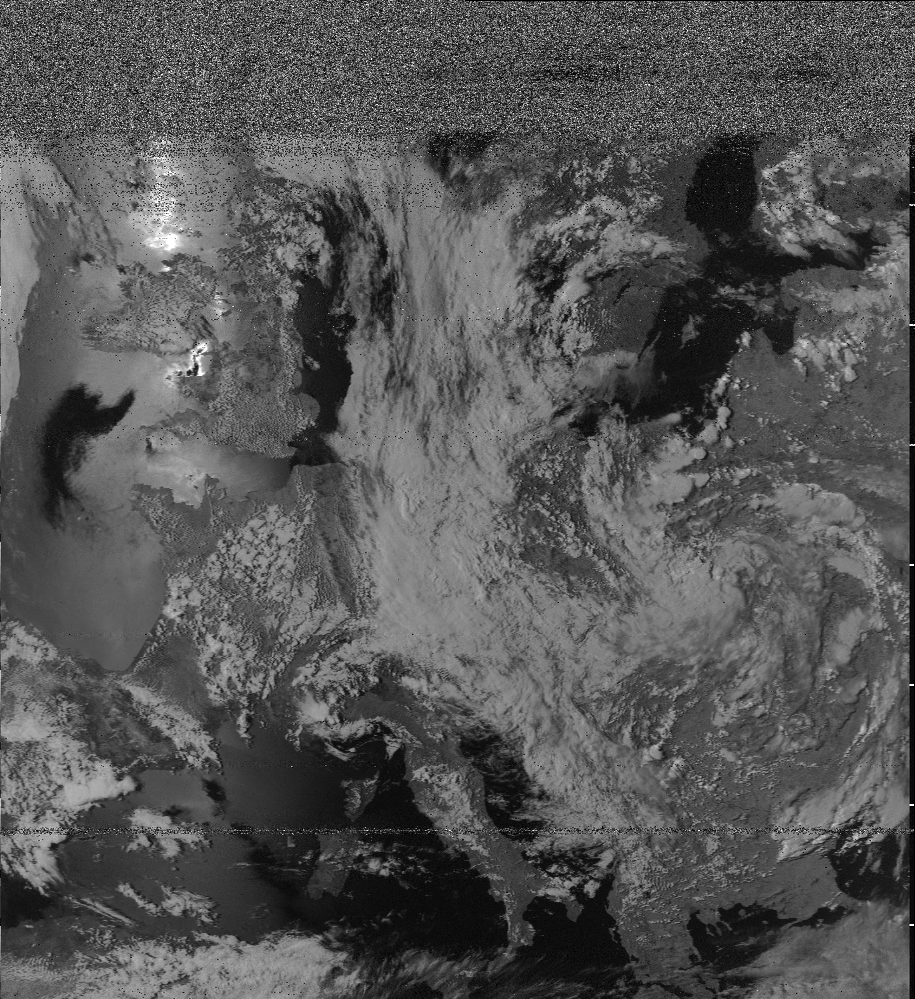
Figure 1. Example of decoded image.

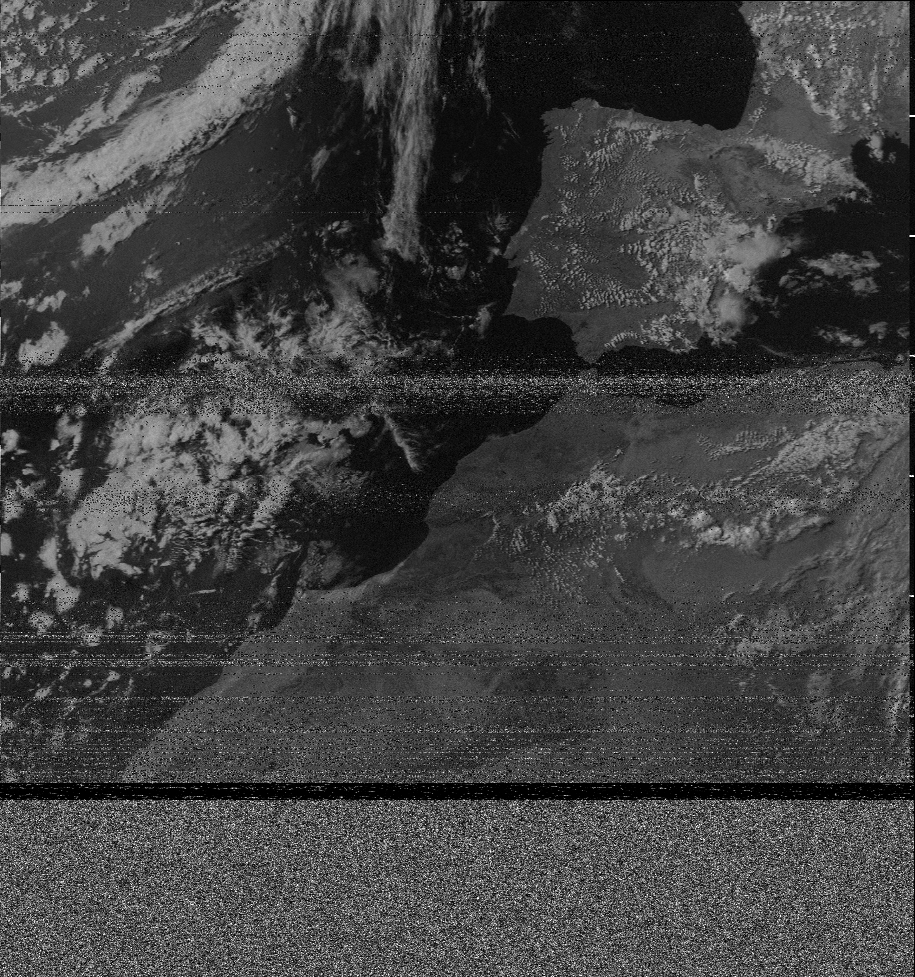
Figure 2. Example of decoded image.

Next step is georeferencing, which has already been described in previous post [1]. On this step, the coordinate system will be assigned to the image, every pixel will have a corresponding geographic coordinates. Main computation is done with gdal library.

Merging images

The goal of the project is to primarily create tools, that could visualize a set of satellite images. It means that we must find a way to combine several images into one standalone raster, which we could then display as a web map or as a virtual globe. 

Using tools from image analysis (image stitching) would be a bad approach, because of two reasons:

  • these methods are approximate in their’s nature
  • do not take in account image distortions

A better approach would be to use pixel’s coordinates. We know the coordinates of each pixel, thus we could tell exactly where it will be located on the new image. For overlapping areas, for each pixel we will have one of 3 cases:

  • no pixels mapped to this pixel
  • 1 pixel is mapped is mapped to this pixel
  • several pixels mapped to this pixel

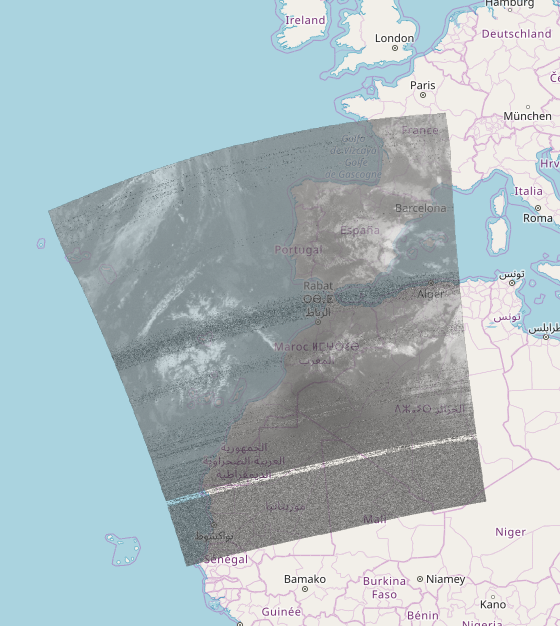
If no pixels have been map to the position, then it will be filled with special no-data value. If there is one pixel, then it’s value will be assigned to the corresponding pixel on new image. If there are several candidates for certain pixel, we will compute new pixel value from them based on some strategy, for example taking max or average. In this example we’ll use averaging for overlapping regions. Below is an example of merging 2 images above, country boundaries added for clarity.

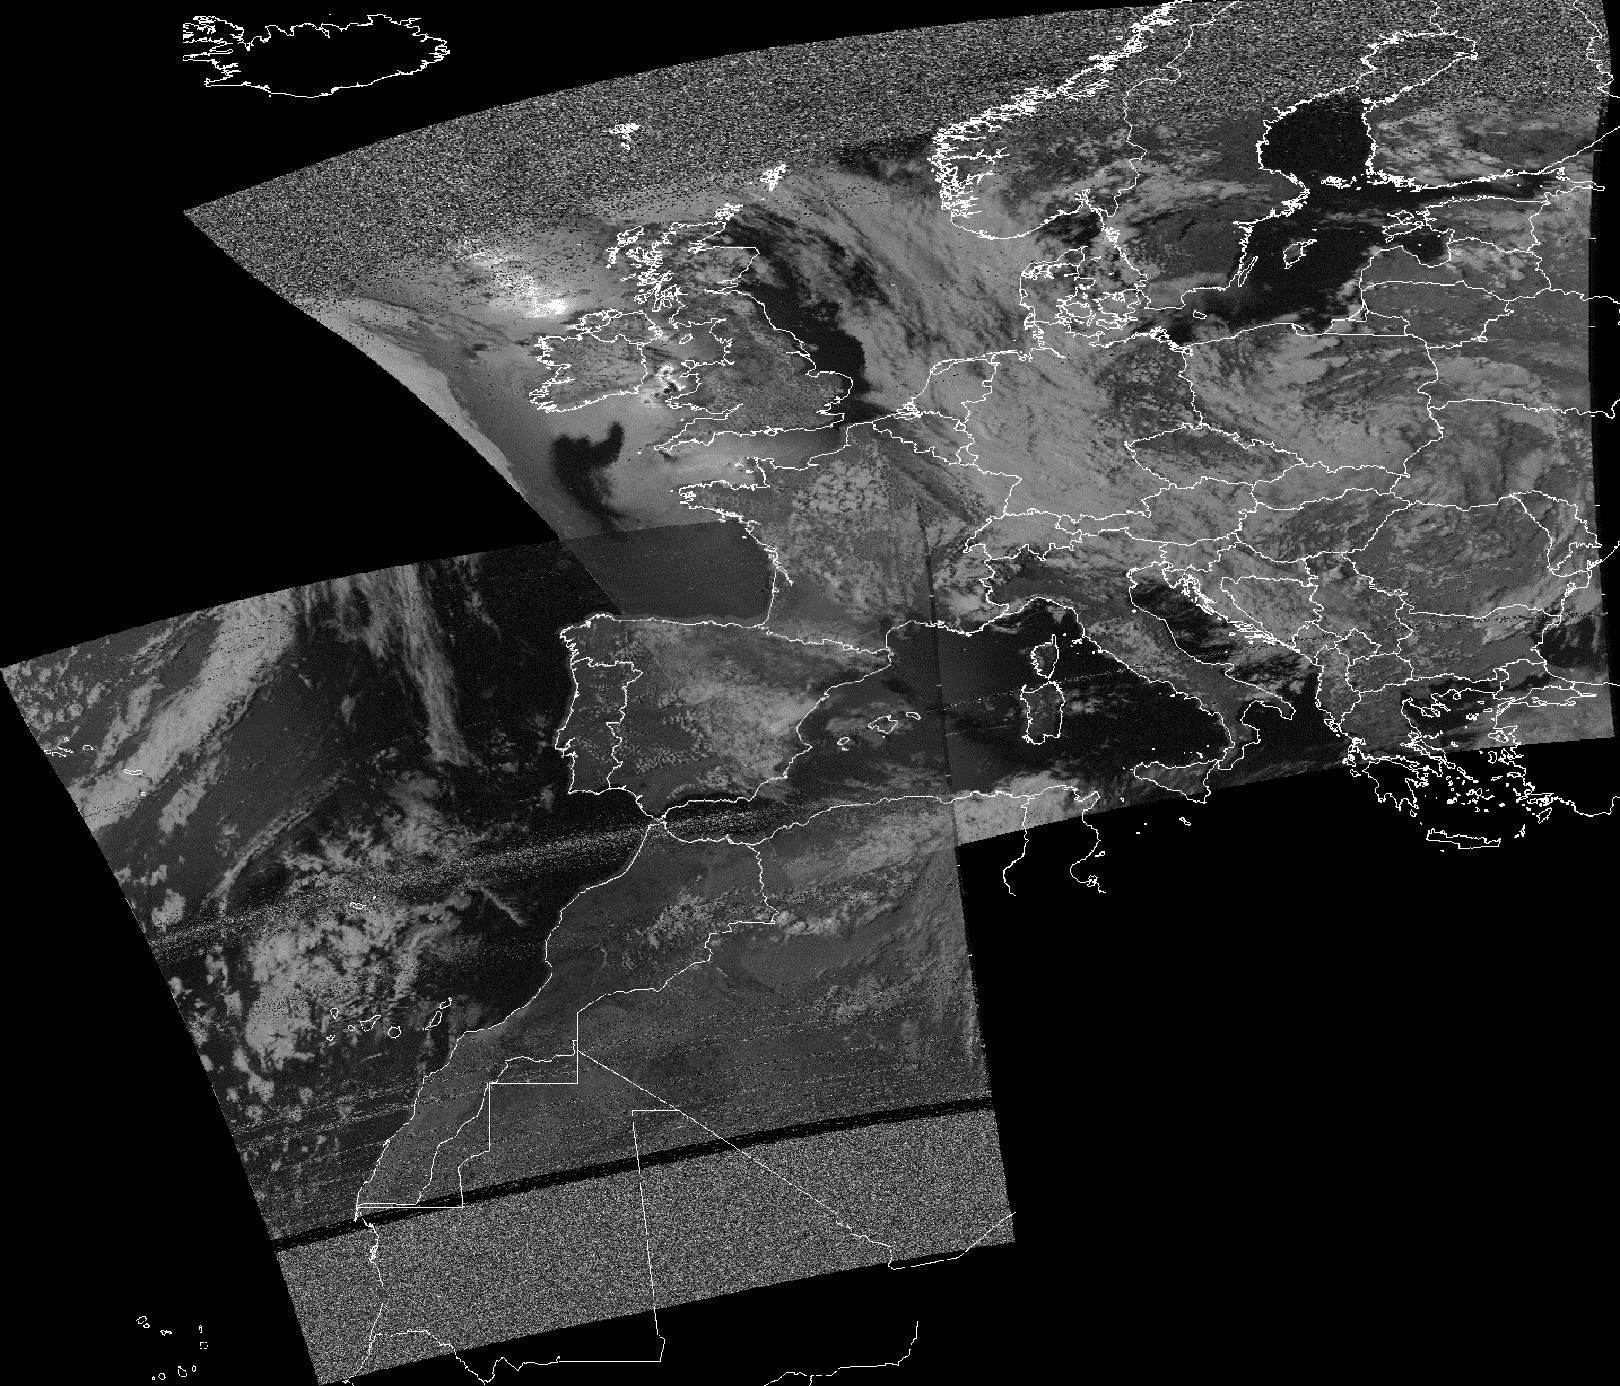
Figure 3. Example of merged satellite images.

As you may see, there is still a contrast present between the images and the overlapping part, the reason for this are different lightning conditions for images. Nevertheless, image quality with this method outperforms other methods, like taking maximum for example.

Creating TMS

On this step our raster will be transformed to yet another representation, which will be used for further visualization.

TMS (Tile Map Service) – is a protocol for serving maps as tiles i. e. splitting the map up into a pyramid of images at multiple zoom levels [2]. See the image to better understand the concept.

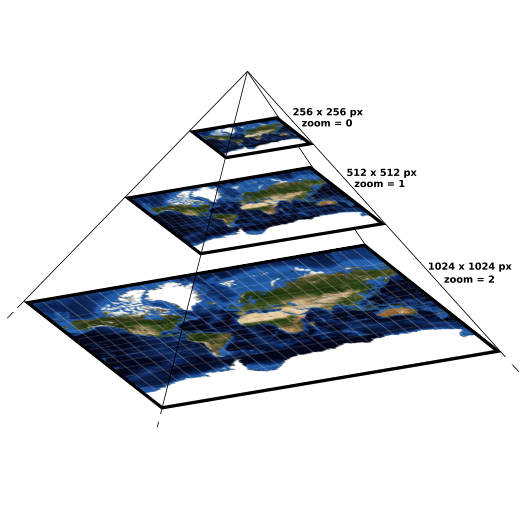
Figure 4. Tiles pyramid.

So for each level zoom level a set of tiles is generated, each tile has it’s own resolution and will be displayed at specific position at specific zoom. To generate this set of tiles gdal2tiles.py program is used, it transforms an input raster into a directory tree with tiles [3].

It should be noted that TMS is not the only choice here, another alternative is WMS (Web Map Service) [4]. 

Interactive web-maps

Finally, having TMS tiles computed we could create a web map. To do this we will use leaflet.js, which is a library for web-mapping applications. [5] We will combine two layers, the first one is our tiled raster, which will be loaded from local directories and the second one is Open Street Map layer which will be loaded from OSM site. The code for map is contained in the map.html file and could be opened directly in browser. You can see a live example here https://caballeto.github.io/map.html, or in the iframe below.

Virtual globe

Another way to visualize satellite images is of course to plot them on virtual globe. Once again we could use already computed TMS tiles here. To render the globe we will use webglearth2 library, which is created exactly for this purpose. Similarly to a web map, we will add an OSM layer as a background layer. To open it locally you will have to start an http server, and then open the globe.html via http. Running commands (run from directory where globe.html is stored): 

  • python -m http.server 8000
  • go to browser and connect to localhost:8000/globe.html.

Or you can simply take a look at an online version below, better view at https://caballeto.github.io/globe.html.  

Software

To create presented visualizations for a raster, you can use generate_map.py tool from directdemod package. It will automatically create tiles from your raster and then will generate corresponding map.html and globe.html files.

Conclusion

In this post we’ve looked at different ways and tools for raster visualization, specifically we’ve analysed the visualization pipeline for satellite imagery. Presented types of visualizations are compatible with many different mapping applications (leaflet, openlayers etc.) and could be easily published and used on the Internet. 

References

  1. https://aerospaceresearch.net/?p=1248
  2. https://wiki.openstreetmap.org/wiki/TMS
  3. https://gdal.org/programs/gdal2tiles.html
  4. https://en.wikipedia.org/wiki/Web_Map_Service
  5. https://leafletjs.com

[GSoC2019|DirectDemod|Vladyslav M] Installing DirectDemod. Map overlays.

This post will cover the installation process of DirectDemod package, we’ll also talk on how to create pretty map overlays using the directdemod.georeferencer module.

Installing DirectDemod

Recently, the installation process for DirectDemod has been updated (currently on Vinay_dev and Vladyslav_dev dev branches only). You must have anaconda or miniconda distribution installed. From here do the following:

  1. Clone repository:
    • git clone https://github.com/aerospaceresearch/DirectDemod
  2. Change branch to Vinay_dev
    • git checkout -b Vinay_dev
  3. Create environment
    • conda env create -f environment.yml -n my_env
  4.  Activate the environment
    • conda activate my_env
  5. Add directdemod module to your PYTHONPATH.
  6. Test installation with pytest.

Create fancy map overlays

Before creating map overlays we need to have a georeferenced image, let’s make one. samples/decoded directory contains 2 already decoded and preprocessed NOAA images ready for georeferencing. Create an empty file – SDRSharp_20190521_170204Z_137500000Hz_IQ.wav in samples directory, it will serve as a placeholder; the image was already extracted but the name of SDR file contains valuable information needed for georeferencing. 

To georeference the image, we will first extract information from the name of SDR file. Go to directdemod directory and type the following command.

python misc.py -f ../samples/SDRSharp_20190521_170204Z_137500000Hz_IQ.wav -i ../samples/decoded/SDRSharp_20190521_170204Z_137500000Hz.png

misc.py extracts data about satellite’s orbit and position, and then embeds it in json format into created tif file.

 Now we will use georefencer.py CLI interface to georeference the image and create a map overlay.  -m or –map option tells the georeferencer to overlay the image with map boundaries after georeferencing.

python georeferencer.py -m -i ../samples/decoded/SDRSharp_20190521_152538Z_137500000Hz.tif

Finally, the georeferenced image.

Figure 1. Georeferenced image combined with country boundaries.

Note on shapefiles

A shapefile is a vector data storage format for storing geographical features [1]. In the context of this application, country boundaries are being represented as a shapefile. Inside the shapefile points may be stored as polygons or as polylines, overlaying an image with polylines will have an effect of overlaying country frontiers, while overlaying an image with polygons will have an effect of overlaying country areas. 

Figure 2. Georeferenced image combined with polygons shapefile.

Further work

The next blog post will discuss merging NOAA satellite images, including different techniques for handling overlapping areas cases.

References

  1. https://en.wikipedia.org/wiki/Shapefile

[GSoC2019|DirectDemod|Vladyslav M] Introduction – Georeferencing NOAA images

Hello everyone!

Let me introduce myself, my name is Vladyslav Mokrousov, I am a second year student at software engineering department of Kyiv Polytechnical Institute, Ukraine. This summer I will be working on Google Summer of Code (GSoC) project for AerospaceResearch.net

Please check my github and twitter.

This blog will briefly describe the goal of the project, and then will proceed to describe what has been done so far.

BigImage and BigGlobe Projection

During this summer I will work on creating software for visualization of satellite imagery, mainly images from NOAA satellites. The goal of the project, as my proposal states:

Current software provides possibility for decoding APT signals received by RTL-SDR receivers, but the task of understanding the extracted data is hard, because an open-source programs for proper visualization of these images do not yet exist. This project aims to create an open-source software to target that issue, so more developers and enthusiasts will receive an efficient tool to help them in their research. The software would provide functionality for creating different types of interactive visualizations of satellite weather images, along with their georeferencing.

Particularly, I am working on software, which will combine many satellite images into one big picture (BigImage). The software will handle cases of overlapping images using different merging strategies. Another main task of the software will be to provide accurate image georeferencing [1].

Image georeferencing

Image georeferencing refers to the process of associating image coordinate system with geographical coordinate system, i. e. each pixel of the image will be paired with certain geocoordinates. This will allow combining these images with maps or with each other.

Figure 1. Georeferenced image combined with map.

An example above shows how the georeferenced image can be used for visualization. The process of georeferencing is divided in two parts:

  1. Computing set of Ground Control Points (GCPs).
  2. Fitting the image to match these GCPs.

To compute GCPs we will use the TLE file, which describes the orbit parameters of the satellite. Using pyorbital module we consistently calculate the position coordinates of satellite and match them with relative position of pixels on the image. The 2 part is carried out by gdal [2] library, which is called via it’s Python API.

Performance

The aim for created software is to produce visualizations of big amount of image data, therefore the implementation should be fast and should handle memory expensive cases. To satisfy this requirement gdal library is used. It is an open source software designed for raster and vector data manipulations. gdal is written in C++, that’s why it is extremely fast. Manual memory management ensures the efficiency of memory use. The implementation makes use of gdal Python bindings, which provide interface for using gdal functionality in Python.

Further work

Image georeferencing is the first step required to produce good looking projections of satellite images, especially for creating image overlays. In the next blog we will talk about map overlays and techniques for merging overlapping parts of NOAA images.

References

  1. https://en.wikipedia.org/wiki/Georeferencing
  2. https://gdal.org/