In my last blog we were at a point where we were able to detect the sync locations in NOAA signal. In this blog, we will look at how the image is extracted and corrected. We will also have a brief look over the AFSK1200 decoder implemented by Andreas Hornig.
Image from signal
In the NOAA APT, the image is amplitude modulated over a 2.4kHz sinusoidal wave. Hence to demodulate, the amplitude information of this wave must be extracted. Since we know the carrier is a sinusoid, we can use Hilbert’s transform to demodulate the image.
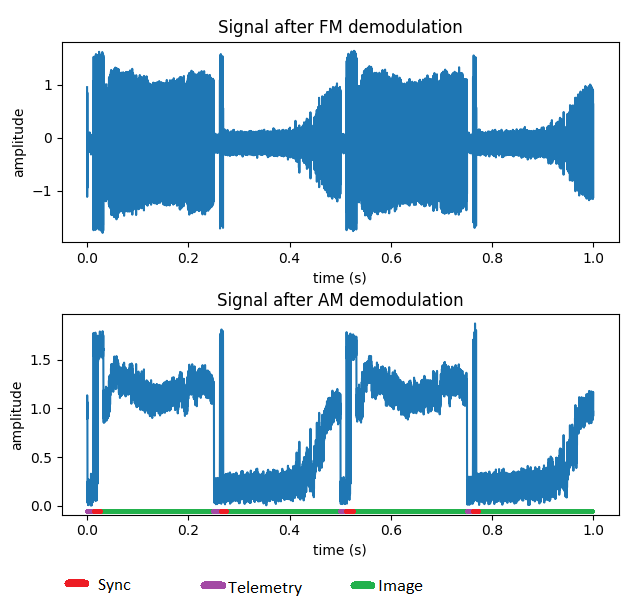
The amplitude at every point denotes the brightness of the pixel, i.e. in grayscale from 0 to 255. To convert a signal value to pixel we need to have some transformation function. To get this function, initially we use the sync flags, which alternate between pixel value 11 and 244. This works, but there are a lot of variations. Hence this is only an initial method. After this we use the calibration strip, in which all the brightness scale from 0 to 255 is sent in steps of 255/8. The software will look primarily for these strips using a state machine, when detected, the signal values and the target pixel values will be used to create a proper transformation function. Then this function is used to correct the color of the image. This method works very well.
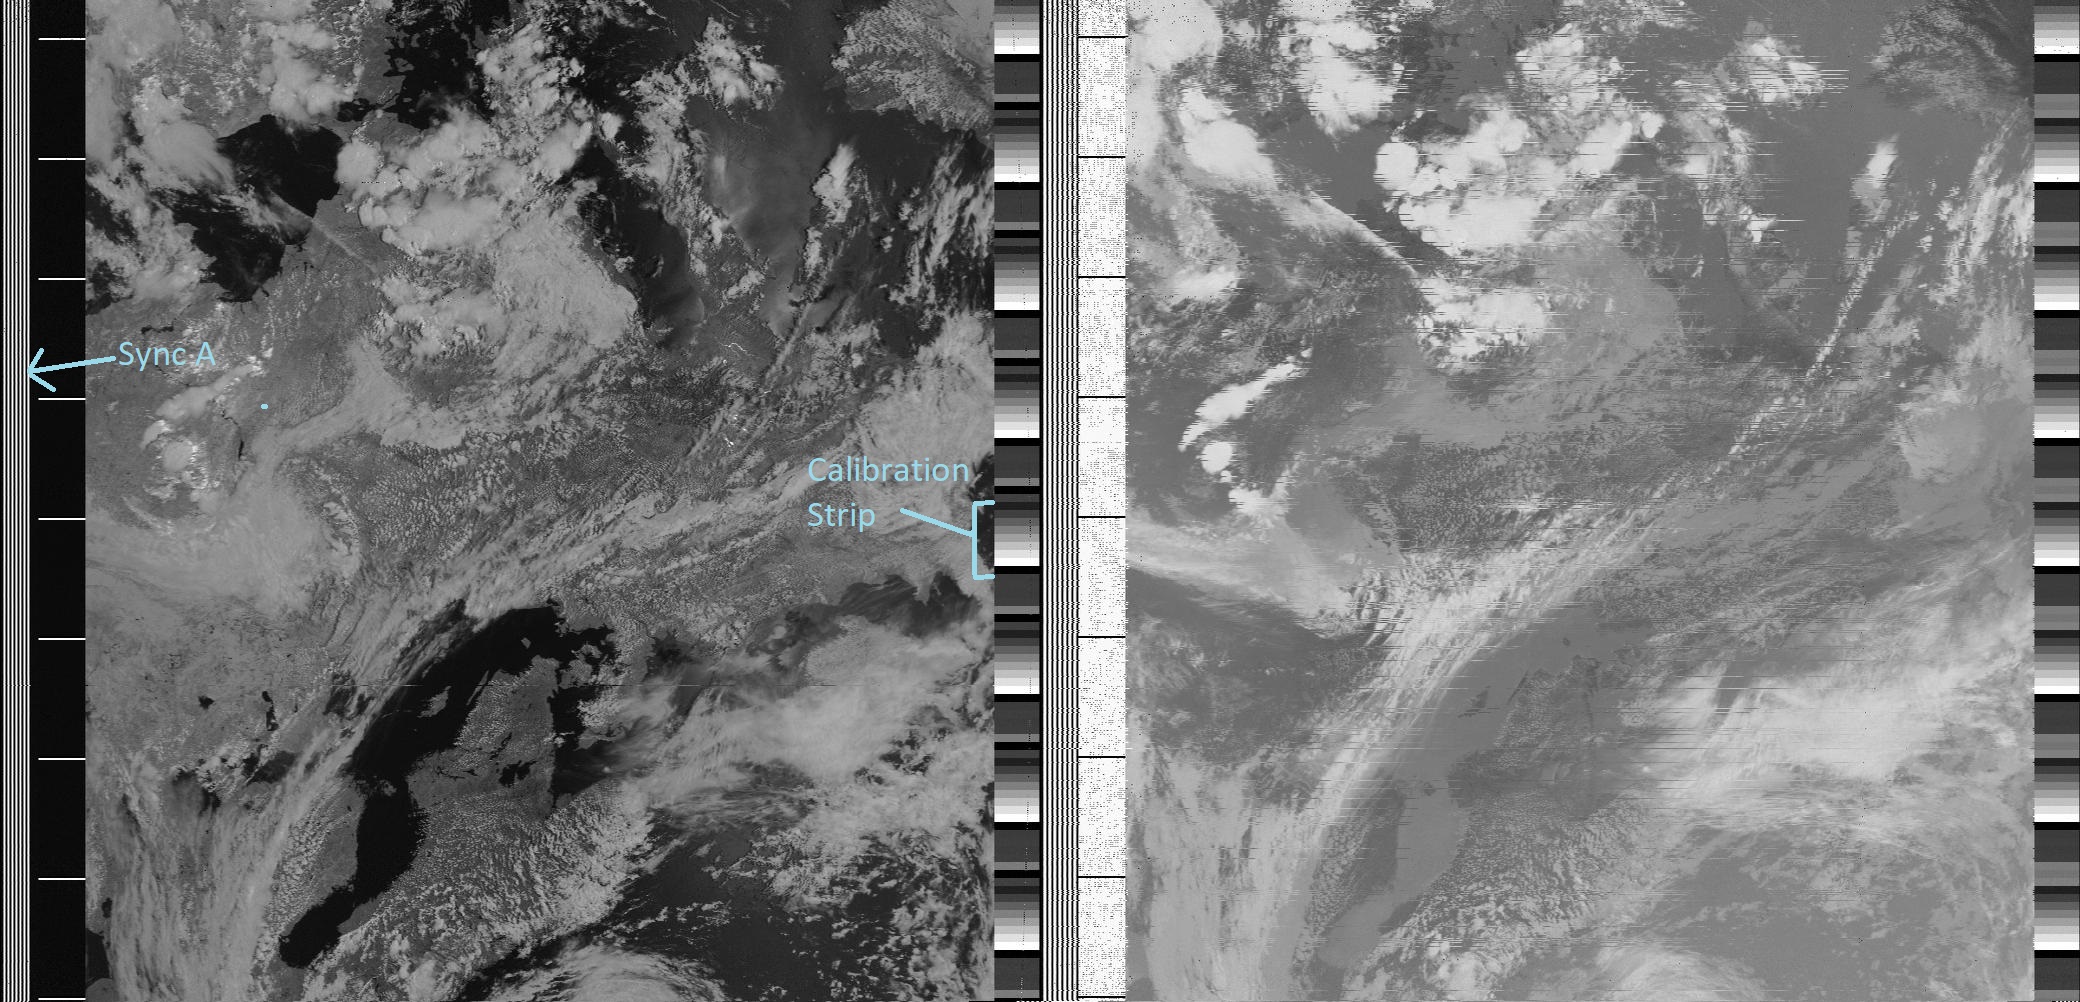
In case sample drop occurs, that is also visible in the generated image. In order to enhance the image, both syncs were used to align the image properly and pixels were interpolated in case of sample drops.
Further image enhancements
Further enhancements could be made visually. For example one can combine the two channel information into differentiating regions of land, sea and clouds. Then those regions could be falsely colored to get better visual images.
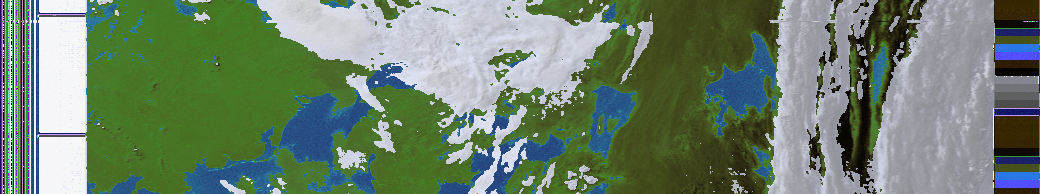
We can also add a map overlay on to the image. This can be done by predicting the satellites location by knowing the time of capture of the signal.

Both of these have been implemented into the software, but are still in experimental status and need further testing and improvement.
AFSK1200 decoding
An AFSK1200 decoder was also added to direct demod libraries, implemented by Andreas Hornig. This decoder can be used to decode the APRS messages sent by various transmitters.
AFSK 1200 signal is basically a Frequency shift keying modulcation, in which a bit is sent by one frequency (1200 Hz) the other one is sent by another frequency (2200 Hz). In order to demodulate this, we use a binary filter, which correlates the incoming signal with either of the frequencies and tells us which is more likely. In order to reduce noise, a bandpass filter was used to only allow frequenies between (1200 – 500)Hz to (2200 + 500)Hz this improves the performance of the binary filter. One possible problem with using this filter is that, if the sampling frequency of input file is large, the cutoff is only a fraction of that, this icreases the complexity of filter design and hence leads to unstability. So, one must keep this in mind while using the demodulator.
After the binary filter, an edge detector is used to detect bit transitions. The benefit of using a peak detector is to reduce chances of false jumps due to noise. After peak detection, the distance between each peaks is used to decide the number of bits between those peaks and a bit stream is constructed out of that. APRS uses NRZI scheme, hence they are decoded into a normal bit stream. Then the starting bit sequence „01111110“ is searched, and bit stuffing is removed. After that every possible message detected, will be tested for cyclic redundency. Those which pass are decoded and returned to the user.